

Question: Having trouble with Part E and cannot get to the answer. If possible please show your work. Thank You! Score: 0.03 of 1 pt 10
Having trouble with Part E and cannot get to the answer. If possible please show your work. Thank You!
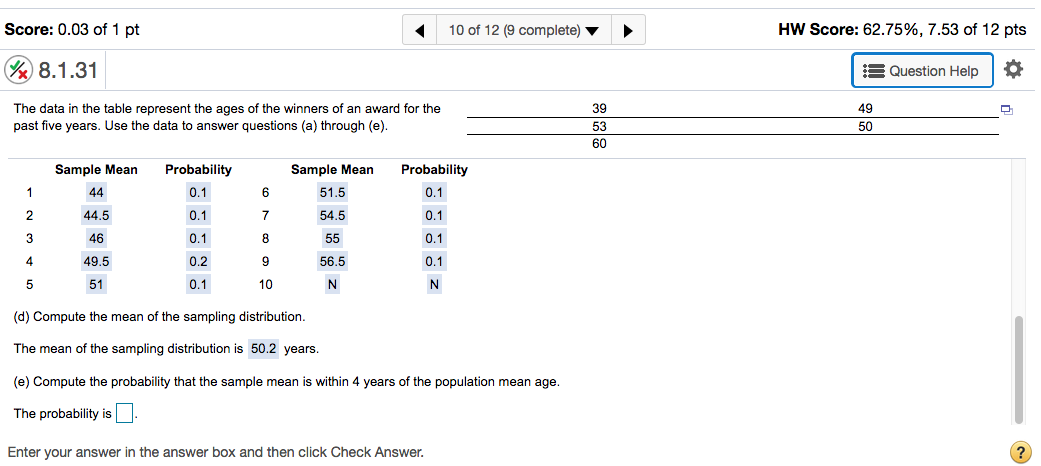
Score: 0.03 of 1 pt 10 of 12 (9 complete) HW Score: 62.75%, 7.53 of 12 pts 8.1.31 Question Help The data in the table represent the ages of the winners of an award for the 39 49 past five years. Use the data to answer questions (a) through (e). 53 50 60 Sample Mean Probability Sample Mean Probability 44 0.1 6 51.5 0.1 N 44.5 0.1 7 54.5 0.1 3 46 0.1 8 55 0.1 49.5 0.2 9 56.5 0.1 5 51 0.1 10 N N (d) Compute the mean of the sampling distribution. The mean of the sampling distribution is 50.2 years. (e) Compute the probability that the sample mean is within 4 years of the population mean age. The probability is Enter your answer in the answer box and then click Check Answer.
Step by Step Solution
There are 3 Steps involved in it

Get step-by-step solutions from verified subject matter experts