

Question: Having trouble with some basics on excel, can anyone please help me out with this? Thanks! 3. Using excel plot temperature versus time for the
Having trouble with some basics on excel, can anyone please help me out with this? Thanks! 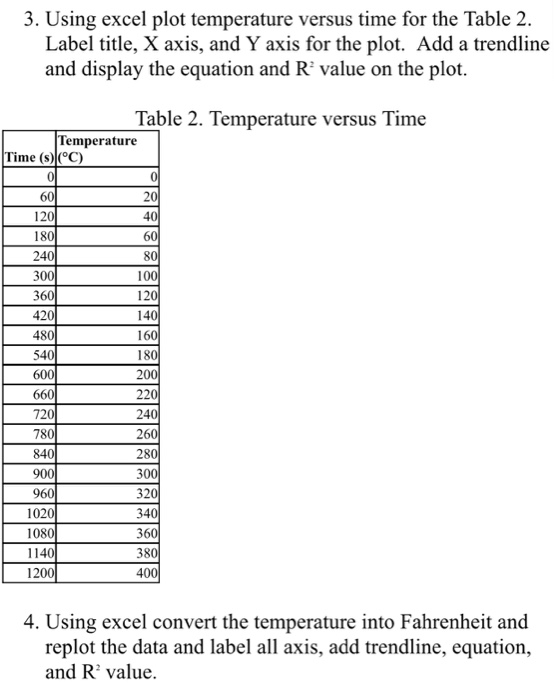
3. Using excel plot temperature versus time for the Table 2. Label title, X axis, and Y axis for the plot. Add a trendline and display the equation and R value on the plot Table 2. Temperature versus Time Temperature Time (Sec) 60 180 240 300 80 420 480 180 600 660 720 780 840 900 220 240 260 280 300 32 102 108 114 1200 36 38 40 4. Using excel convert the temperature into Fahrenheit and replot the data and label all axis, add trendline, equation, and R' value
Step by Step Solution
There are 3 Steps involved in it
1 Expert Approved Answer
Step: 1 Unlock

Question Has Been Solved by an Expert!
Get step-by-step solutions from verified subject matter experts
Step: 2 Unlock
Step: 3 Unlock