

Question: HCT protected.pdf.pdf (10 Marks) Question No 1: Having gathered the background information, the next stage is to start the detailed numerical analysis of the financial
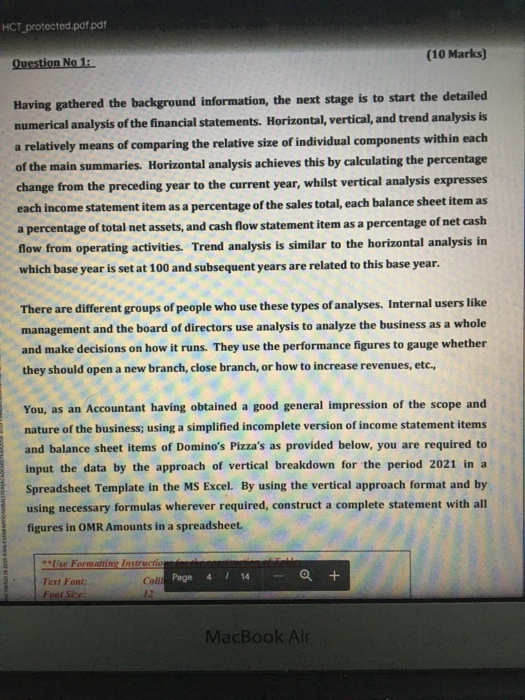
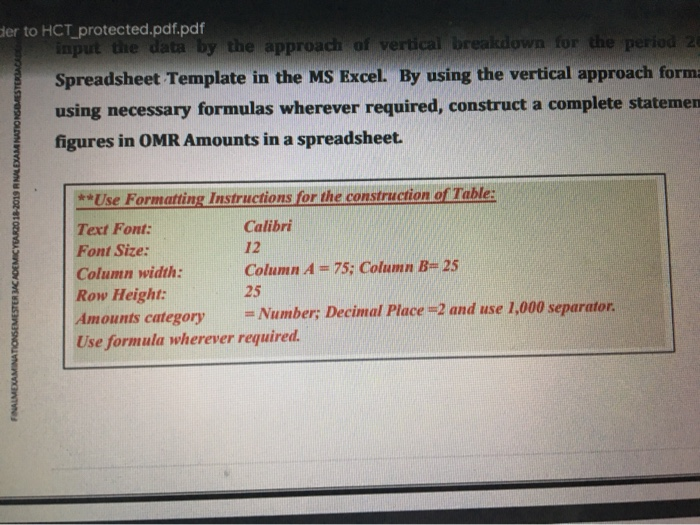
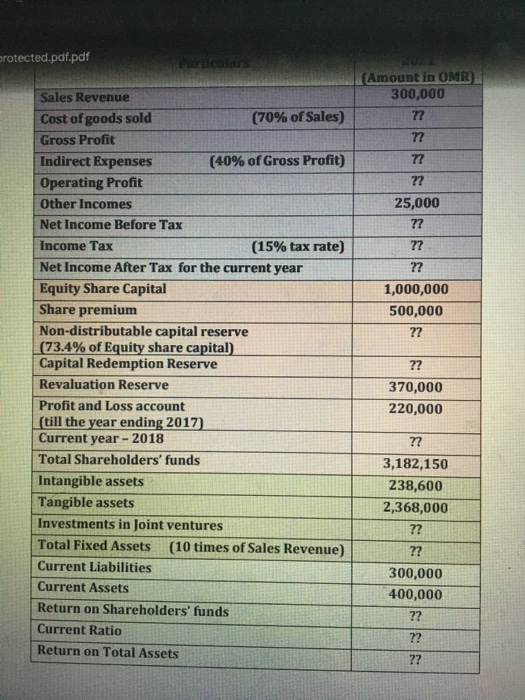
HCT protected.pdf.pdf (10 Marks) Question No 1: Having gathered the background information, the next stage is to start the detailed numerical analysis of the financial statements. Horizontal, vertical, and trend analysis is a relatively means of comparing the relative size of individual components within each of the main summaries. Horizontal analysis achieves this by calculating the percentage change from the preceding year to the current year, whilst vertical analysis expresses each income statement item as a percentage of the sales total, each balance sheet item as a percentage of total net assets, and cash flow statement item as a percentage of net cash flow from operating activities. Trend analysis is similar to the horizontal analysis in which base year is set at 100 and subsequent years are related to this base year. There are different groups of people who use these types of analyses. Internal users like management and the board of directors use analysis to analyze the business as a whole and make decisions on how it runs. They use the performance figures to gauge whether they should open a new branch, close branch, or how to increase revenues, etc., You, as an Accountant having obtained a good general impression of the scope and nature of the business; using a simplified incomplete version of income statement items and balance sheet items of Domino's Pizza's as provided below, you are required to input the data by the approach of vertical breakdown for the period 2021 in a Spreadsheet Template in the MS Excel. By using the vertical approach format and by using necessary formulas wherever required, construct a complete statement with all figures in OMR Amounts in a spreadsheet. Use Formatting Instructio Text Font: Font Size 12 Calif Page 4 114 Q + MacBook Air Ser to HCT_protected.pdf.pdf input the data by the approach of vertical breakdown for the period 20 Spreadsheet Template in the MS Excel. By using the vertical approach form using necessary formulas wherever required, construct a complete statemen figures in OMR Amounts in a spreadsheet. FINALMEXAMINATIONSEMESTER ACADEMIC YEAR 2018-2019 RNDAM TIONSMESTER **Use Formatting Instructions for the construction of Table: Text Font: Calibri Font Size: 12 Column width: Column A = 75; Column B= 25 Row Height: 25 Amounts category = Number; Decimal Place =2 and use 1,000 separator. Use formula wherever required. protected.pdf.pdf (Amount in OMR 300,000 72 77 72 77 25,000 ?? ?? ?? 1,000,000 500,000 ?? ?? Sales Revenue Cost of goods sold (70% of Sales) Gross Profit Indirect Expenses (40% of Gross Profit) Operating Profit Other Incomes Net Income Before Tax Income Tax (15% tax rate) Net Income After Tax for the current year Equity Share Capital Share premium Non-distributable capital reserve (73.4% of Equity share capital) Capital Redemption Reserve Revaluation Reserve Profit and Loss account (till the year ending 2017) Current year - 2018 Total Shareholders' funds Intangible assets Tangible assets Investments in Joint ventures Total Fixed Assets (10 times of Sales Revenue) Current Liabilities Current Assets Return on Shareholders' funds Current Ratio Return on Total Assets 370,000 220,000 ?? 3,182,150 238,600 2,368,000 ?? ?? 300,000 400,000
Step by Step Solution
There are 3 Steps involved in it

Get step-by-step solutions from verified subject matter experts