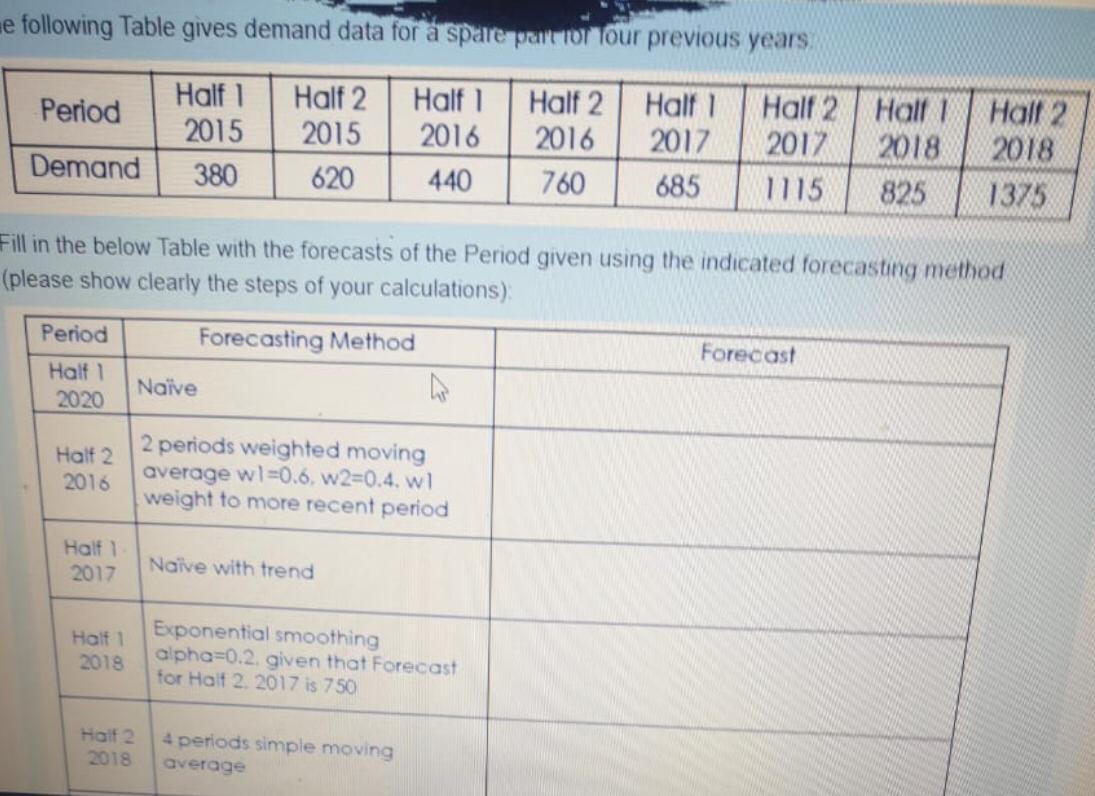
Question: he following Table gives demand data for a spare paltor four previous years Period Half 1 2015 380 Half 2 2015 620 Half 1 2016

he following Table gives demand data for a spare

he following Table gives demand data for a spare paltor four previous years Period Half 1 2015 380 Half 2 2015 620 Half 1 2016 440 Half 2 2016 760 Half 1 2017 685 Halt 2 Half 1 2017 2018 1115 825 Demand Hall 2 2018 1375 Fill in the below Table with the forecasts of the Period given using the indicated forecasting method (please show clearly the steps of your calculations) Period Forecasting Method Forecast Half 1 2020 Naive Halt 2 2016 2 periods weighted moving average wl=0.6, W2=0.4. w1 weight to more recent period Half 1 2017 Naive with trend Half 1 2018 Exponential smoothing alpha=0.2. given that Forecast for Half 2. 2017 is 750 Hoit 2 2018 4 periods simple moving average he following Table gives demand data for a spare paltor four previous years Period Half 1 2015 380 Half 2 2015 620 Half 1 2016 440 Half 2 2016 760 Half 1 2017 685 Halt 2 Half 1 2017 2018 1115 825 Demand Hall 2 2018 1375 Fill in the below Table with the forecasts of the Period given using the indicated forecasting method (please show clearly the steps of your calculations) Period Forecasting Method Forecast Half 1 2020 Naive Halt 2 2016 2 periods weighted moving average wl=0.6, W2=0.4. w1 weight to more recent period Half 1 2017 Naive with trend Half 1 2018 Exponential smoothing alpha=0.2. given that Forecast for Half 2. 2017 is 750 Hoit 2 2018 4 periods simple moving average

Step by Step Solution

There are 3 Steps involved in it

1 Expert Approved Answer
Step: 1 Unlock blur-text-image
Question Has Been Solved by an Expert!

Get step-by-step solutions from verified subject matter experts

Step: 2 Unlock
Step: 3 Unlock

Students Have Also Explored These Related General Management Questions!