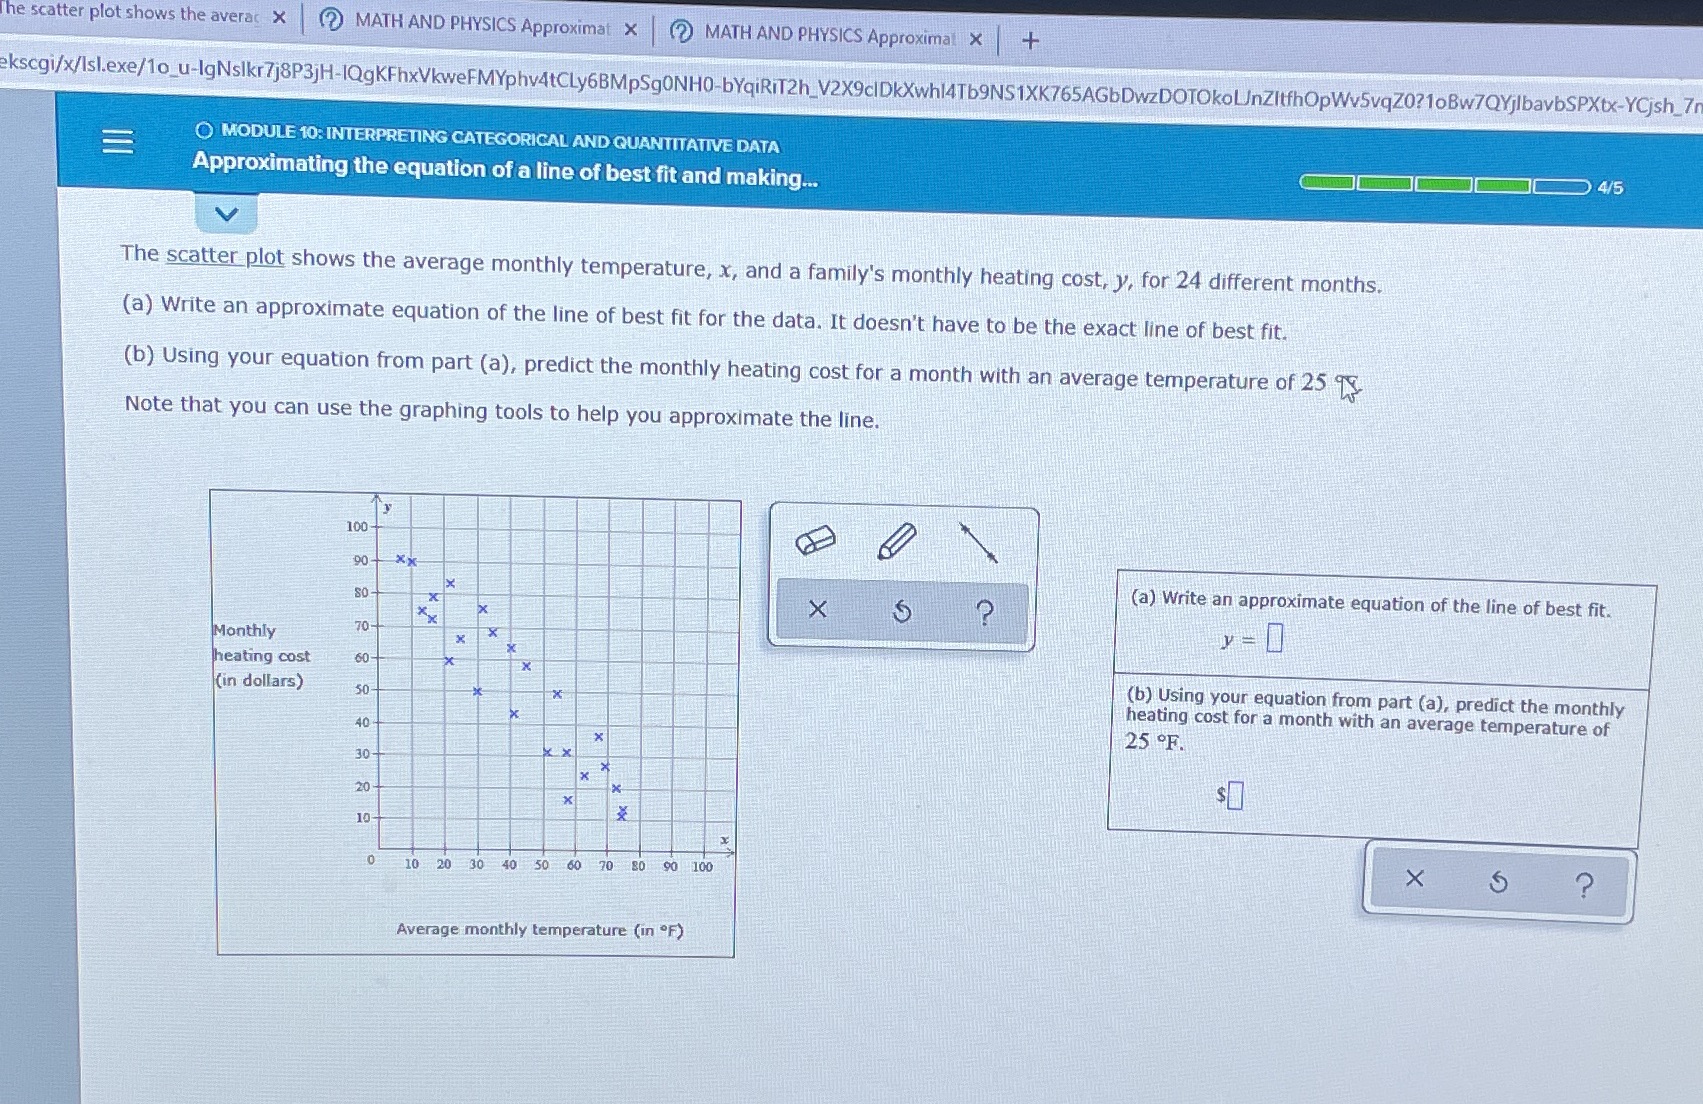
Question: he scatter plot shows the averas X (?) MATH AND PHYSICS Approximate X () MATH AND PHYSICS Approximal X + ekscgi/x/Isl.exe/10_u-lgNslkr7j8P3jH-IQgKFhxVkweFMYphv4tCLy6BMpSgONHO-bYqiRIT2h_V2X9clDkXwhl4Tb9NS1XK765AGbDwzDOTOkoLJnZitfhOpWv5vqZO?1Bw7QYjibavbSPXtx-YCjsh_7 MODULE 10: INTERPRETING CATEGORICAL

he scatter plot shows the averas X (?) MATH AND
he scatter plot shows the averas X (?) MATH AND PHYSICS Approximate X () MATH AND PHYSICS Approximal X + ekscgi/x/Isl.exe/10_u-lgNslkr7j8P3jH-IQgKFhxVkweFMYphv4tCLy6BMpSgONHO-bYqiRIT2h_V2X9clDkXwhl4Tb9NS1XK765AGbDwzDOTOkoLJnZitfhOpWv5vqZO?1Bw7QYjibavbSPXtx-YCjsh_7 MODULE 10: INTERPRETING CATEGORICAL AND QUANTITATIVE DATA Approximationg the equation of a line of best fit and making... 4/5 The scatter plot shows the average monthly temperature, x, and a family's monthly heating cost, y, for 24 different months. (a) Write an approximate equation of the line of best fit for the data. It doesn't have to be the exact line of best fit. (b) Using your equation from part (a), predict the monthly heating cost for a month with an average temperature of 25 13 Note that you can use the graphing tools to help you approximate the line. 100 DO (a) Write an approximate equation of the line of best fit. X ? 70 Monthly heating cost 60 (in dollars) (b) Using your equation from part (a), predict the monthly 50 heating cost for a month with an average temperature of 40 25 OF. 30 20 X 10 O 10 20 30 40 50 60 70 80 90 100 X ? Average monthly temperature (in F)

Step by Step Solution

There are 3 Steps involved in it

1 Expert Approved Answer
Step: 1 Unlock blur-text-image
Question Has Been Solved by an Expert!

Get step-by-step solutions from verified subject matter experts

Step: 2 Unlock
Step: 3 Unlock

Students Have Also Explored These Related Mathematics Questions!