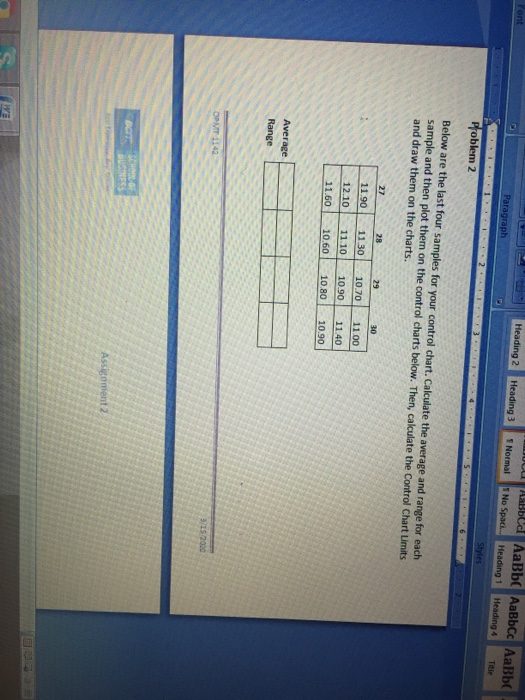
Question: Heading 2 Heading 3 Normal No Spac... Heading 1 ABB Aalbi Heading 4 Title Paragraph Style Problem 2 Below are the last four samples for

Heading 2 Heading 3 Normal No Spac... Heading 1
Heading 2 Heading 3 Normal No Spac... Heading 1 ABB Aalbi Heading 4 Title Paragraph Style Problem 2 Below are the last four samples for your control chart. Calculate the average and range for each sample and then plot them on the control charts below. Then, calculate the Control Chart Umits and draw them on the charts. _11.90 12.10 11.50 11.30 11.10 1060 1070 10.90 1080 11.00 11.40 10.90 Average Range BCIT. BCIT SCHOOL OF BUSINESS Assignment 2 veras 11.54 erage Chart 7 7-4 11.40 1 11. OCTE 1 TA 10 11 12 13 14 15 16 17 Paragraph. Range Chart with

Step by Step Solution

There are 3 Steps involved in it

1 Expert Approved Answer
Step: 1 Unlock blur-text-image
Question Has Been Solved by an Expert!

Get step-by-step solutions from verified subject matter experts

Step: 2 Unlock
Step: 3 Unlock

Students Have Also Explored These Related General Management Questions!