

Question: Heating and Cooling Load Calculations Chapter 2 4 - Plot curves showing the variation in dry - bulb, wet - bulb and dew point temperatures
Heating and Cooling Load Calculations
Chapter
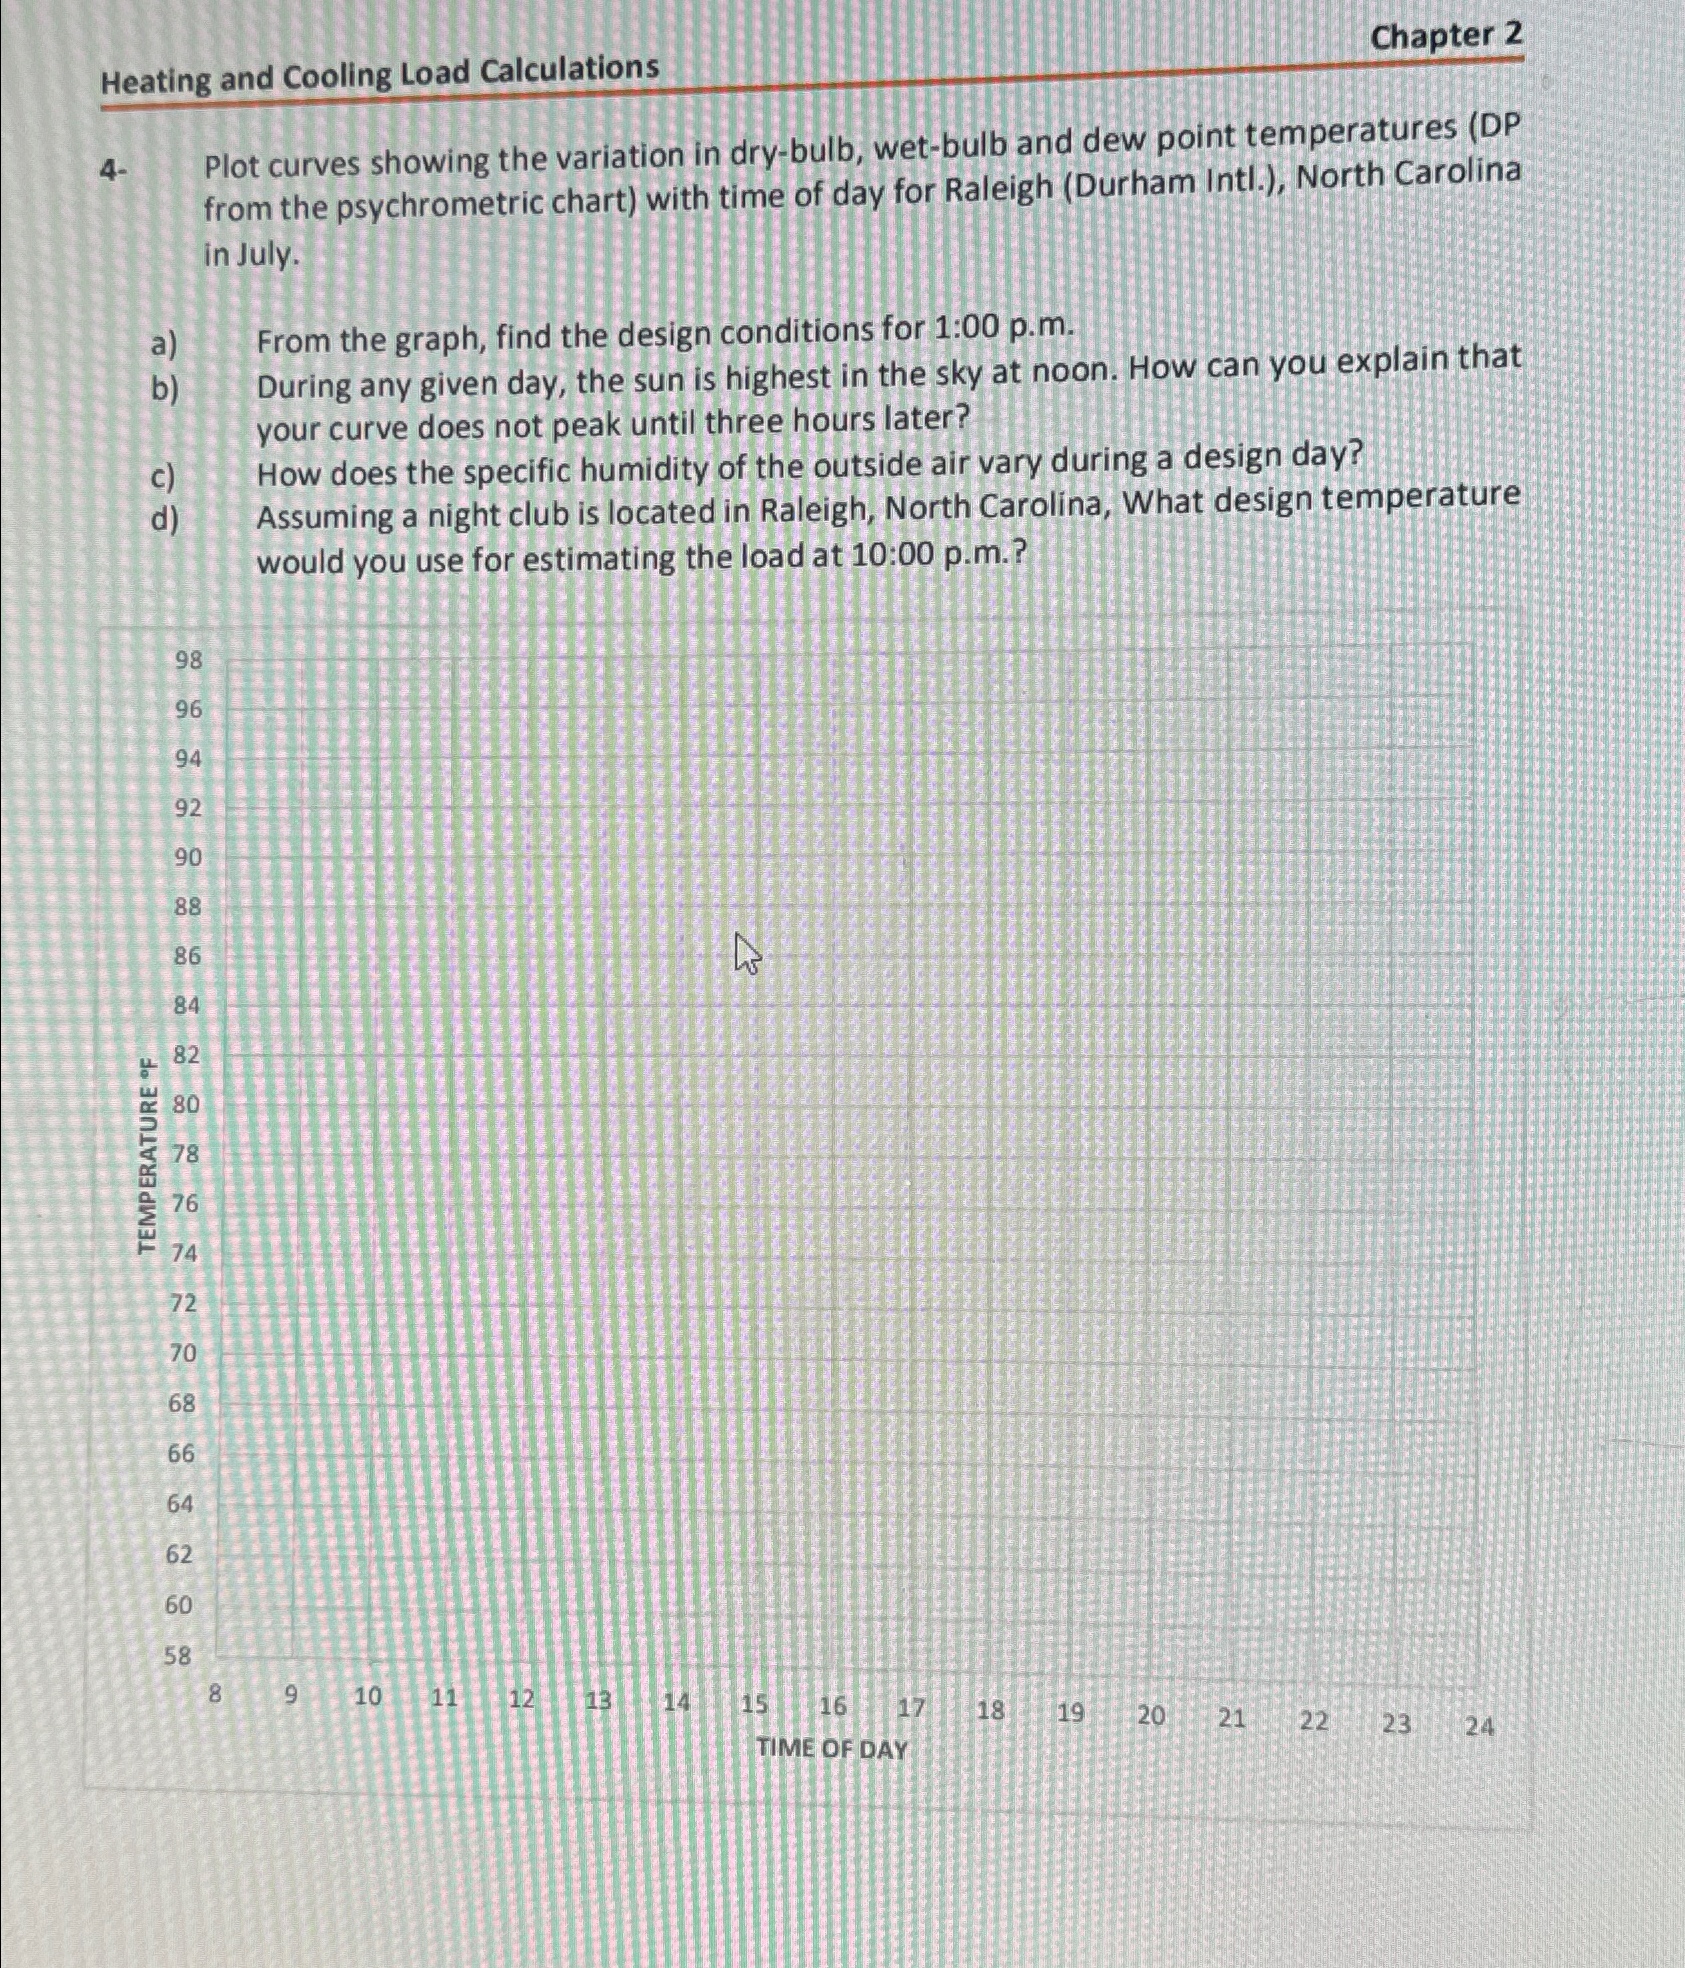
Plot curves showing the variation in drybulb, wetbulb and dew point temperatures DP from the psychrometric chart with time of day for Raleigh Durham IntI. North Carolina in July.
a From the graph, find the design conditions for : pm
b During any given day, the sun is highest in the sky at noon. How can you explain that your curve does not peak until three hours later?
c How does the specific humidity of the outside air vary during a design day?
d Assuming a night club is located in Raleigh, North Carolina, What design temperature would you use for estimating the load at : pm
Step by Step Solution
There are 3 Steps involved in it
1 Expert Approved Answer
Step: 1 Unlock

Question Has Been Solved by an Expert!
Get step-by-step solutions from verified subject matter experts
Step: 2 Unlock
Step: 3 Unlock