

Question: Helllllppppppp analyzing financial leverage ratio and Companys operating leverage ratio for the 4 years CASH FLOW 2020-12-31 2019-12-31 2018-12-31 2017-12-31 Net Income 372,424,000 666,741,000 797,896,000
Helllllppppppp
analyzing financial leverage ratio and Companys operating leverage ratio for the 4 years
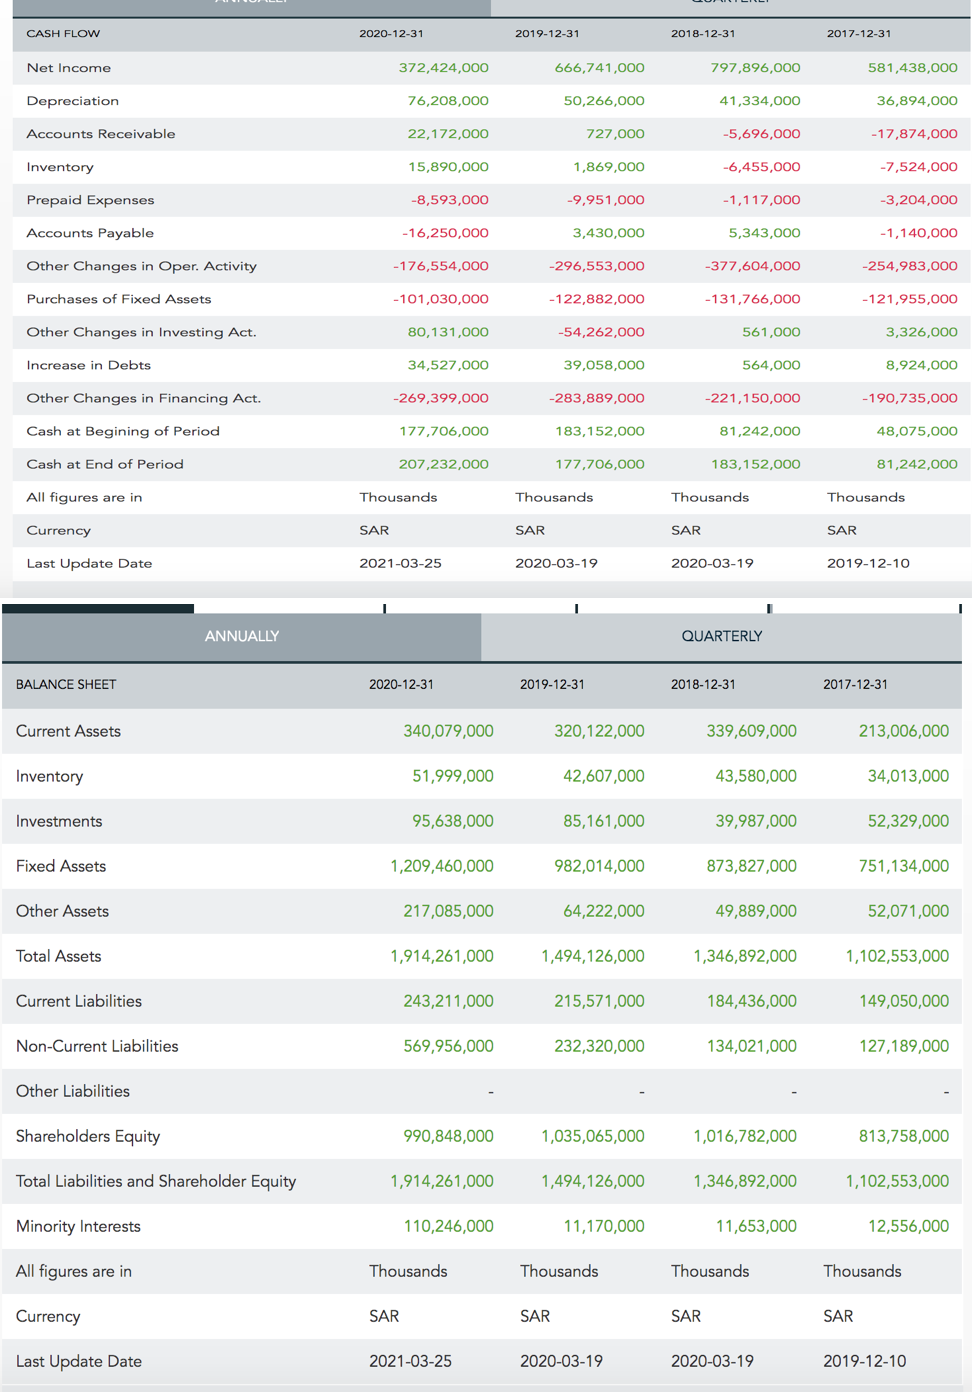
CASH FLOW 2020-12-31 2019-12-31 2018-12-31 2017-12-31 Net Income 372,424,000 666,741,000 797,896,000 581,438,000 Depreciation 76,208,000 50,266,000 41,334,000 36,894,000 Accounts Receivable 22,172,000 727,000 -5,696,000 -17,874,000 Inventory 15,890,000 1,869,000 -6,455,000 -7,524,000 Prepaid Expenses -8,593,000 -9,951,000 -1,117,000 -3,204,000 Accounts Payable -16,250,000 3,430,000 5,343,000 -1,140,000 Other Changes in Oper. Activity -176,554,000 -296,553,000 -377,604,000 -254,983,000 Purchases of Fixed Assets -101,030,000 -122,882,000 -131,766,000 -121,955,000 Other Changes in Investing Act. 80,131,000 -54,262,000 561,000 3,326,000 Increase in Debts 34,527,000 39,058,000 564,000 8,924,000 Other Changes in Financing Act. -269,399,000 -283,889,000 -221,150,000 -190,735,000 Cash at Begining of Period 177,706,000 183,152,000 81,242,000 48,075,000 Cash at End of Period 207,232,000 177,706,000 183,152,000 81,242,000 All figures are in Thousands Thousands Thousands Thousands Currency SAR SAR SAR SAR Last Update Date 2021-03-25 2020-03-19 2020-03-19 2019-12-10 ANNUALLY QUARTERLY BALANCE SHEET 2020-12-31 2019-12-31 2018-12-31 2017-12-31 Current Assets 340,079,000 320,122,000 339,609,000 213,006,000 Inventory 51,999,000 42,607,000 43,580,000 34,013,000 Investments 95,638,000 85,161,000 39,987,000 52,329,000 Fixed Assets 1,209,460,000 982,014,000 873,827,000 751,134,000 Other Assets 217,085,000 64,222,000 49,889,000 52,071,000 Total Assets 1,914,261,000 1,494,126,000 1,346,892,000 1,102,553,000 Current Liabilities 243,211,000 215,571,000 184,436,000 149,050,000 Non-Current Liabilities 569,956,000 232,320,000 134,021,000 127,189,000 Other Liabilities Shareholders Equity 990,848,000 1,035,065,000 1,016,782,000 813,758,000 Total Liabilities and Shareholder Equity 1,914,261,000 1,494,126,000 1,346,892,000 1,102,553,000 Minority Interests 110,246,000 11,170,000 11,653,000 12,556,000 All figures are in Thousands Thousands Thousands Thousands Currency SAR SAR SAR SAR Last Update Date 2021-03-25 2020-03-19 2020-03-19 2019-12-10
Step by Step Solution
There are 3 Steps involved in it

Get step-by-step solutions from verified subject matter experts