

Question: Hello all , so this is the problem s an answer I found the table below and directly the Graph , I have no idea
Hello all , so this is the problem s an answer I found the table below and directly the Graph , I have no idea how to plot that on excel I tried every possible way can someone please give me more details like how to enter the data the get this chart ! I need an answer ASAP , thank you 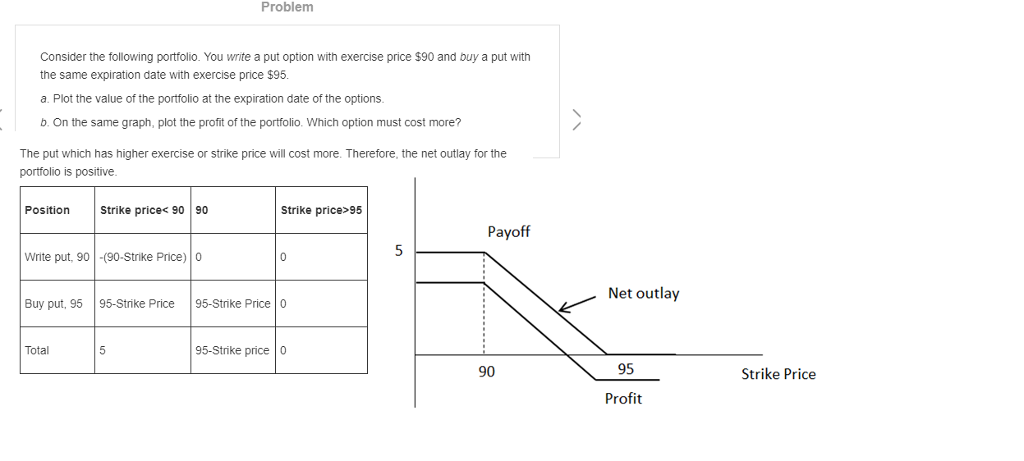
Problem Consider the following portfolio. You write a put option with exercise price $90 and buy a put with the same expiration date with exercise price $95. a. Plot the value of the portfolio at the expiration date of the options b. On the same graph, plot the profit of the portfolio. Which option must cost more? The put which has higher exercise or strike price will cost more. Therefore, the net outlay for the portfolio is positive. Strike prices 90 90 Strike price> 95 Payoff Write put, 90-(90-Strike Price) 0 Net outlay Buy put, 95 95-Strike Price 95-Strike Price 0 Total 95-Strike price0 90 95 Strike Price Profit
Step by Step Solution
There are 3 Steps involved in it

Get step-by-step solutions from verified subject matter experts