

Question: Hello, B U VVA E v v % 9 00 -20 E29 X V fx A B C D E F G H 1 SUMMARY


Hello,
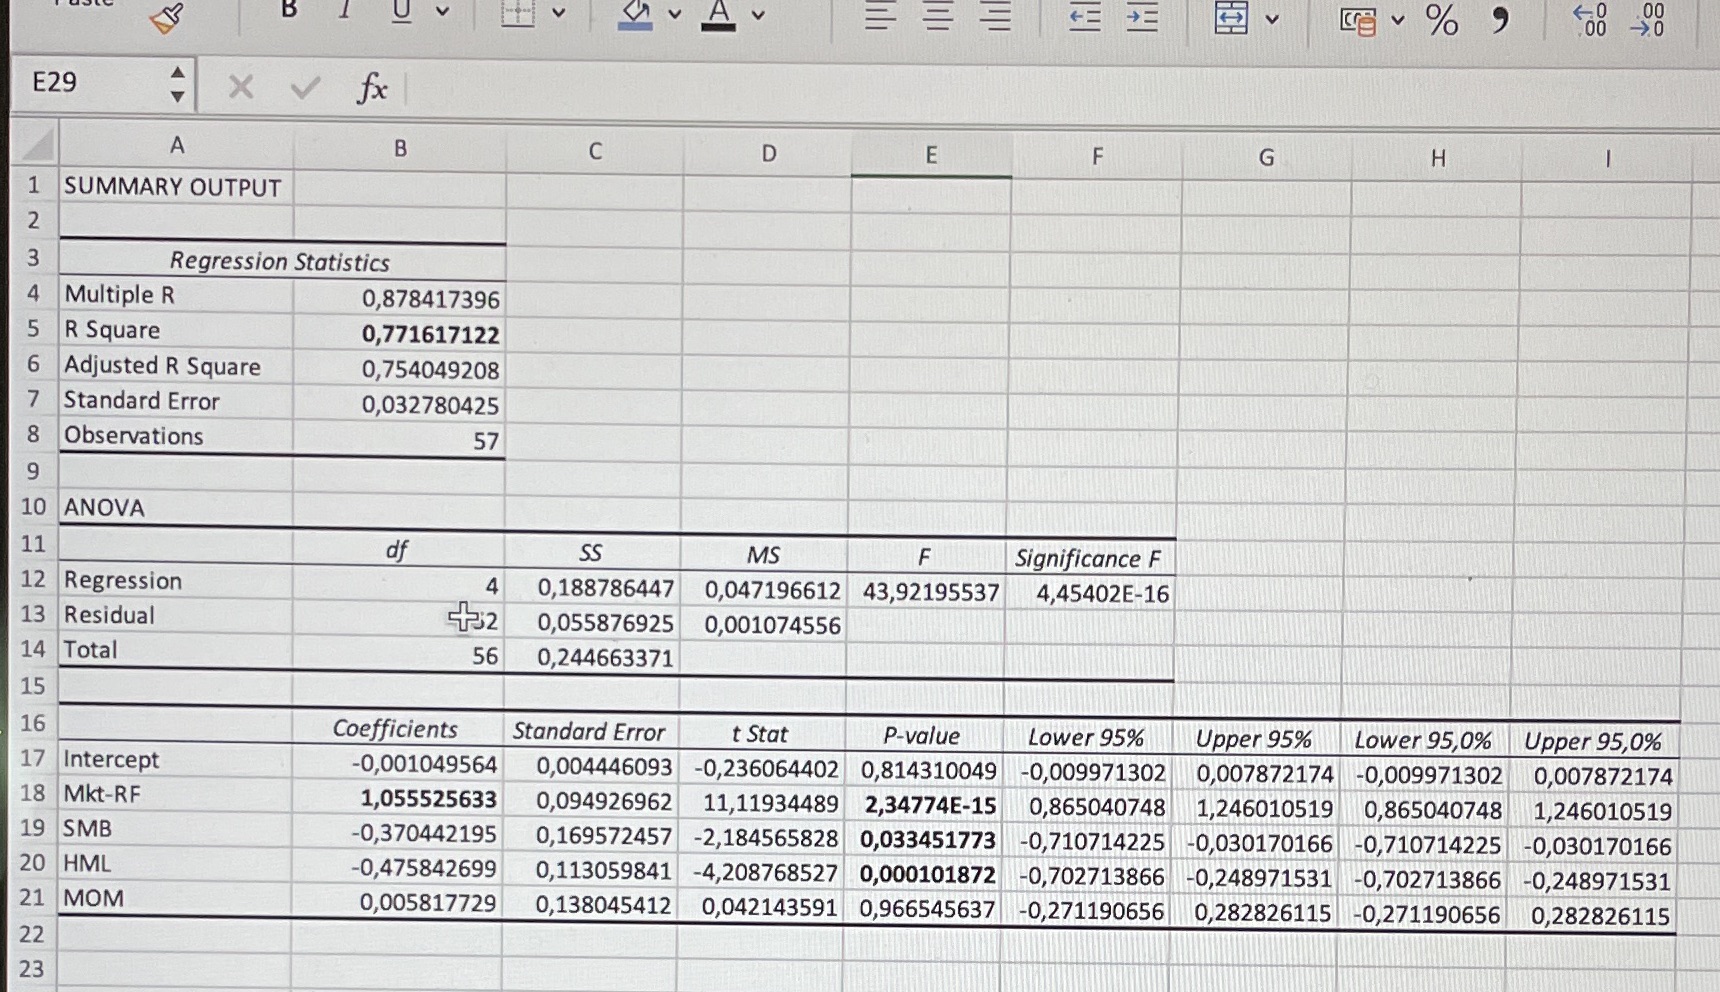


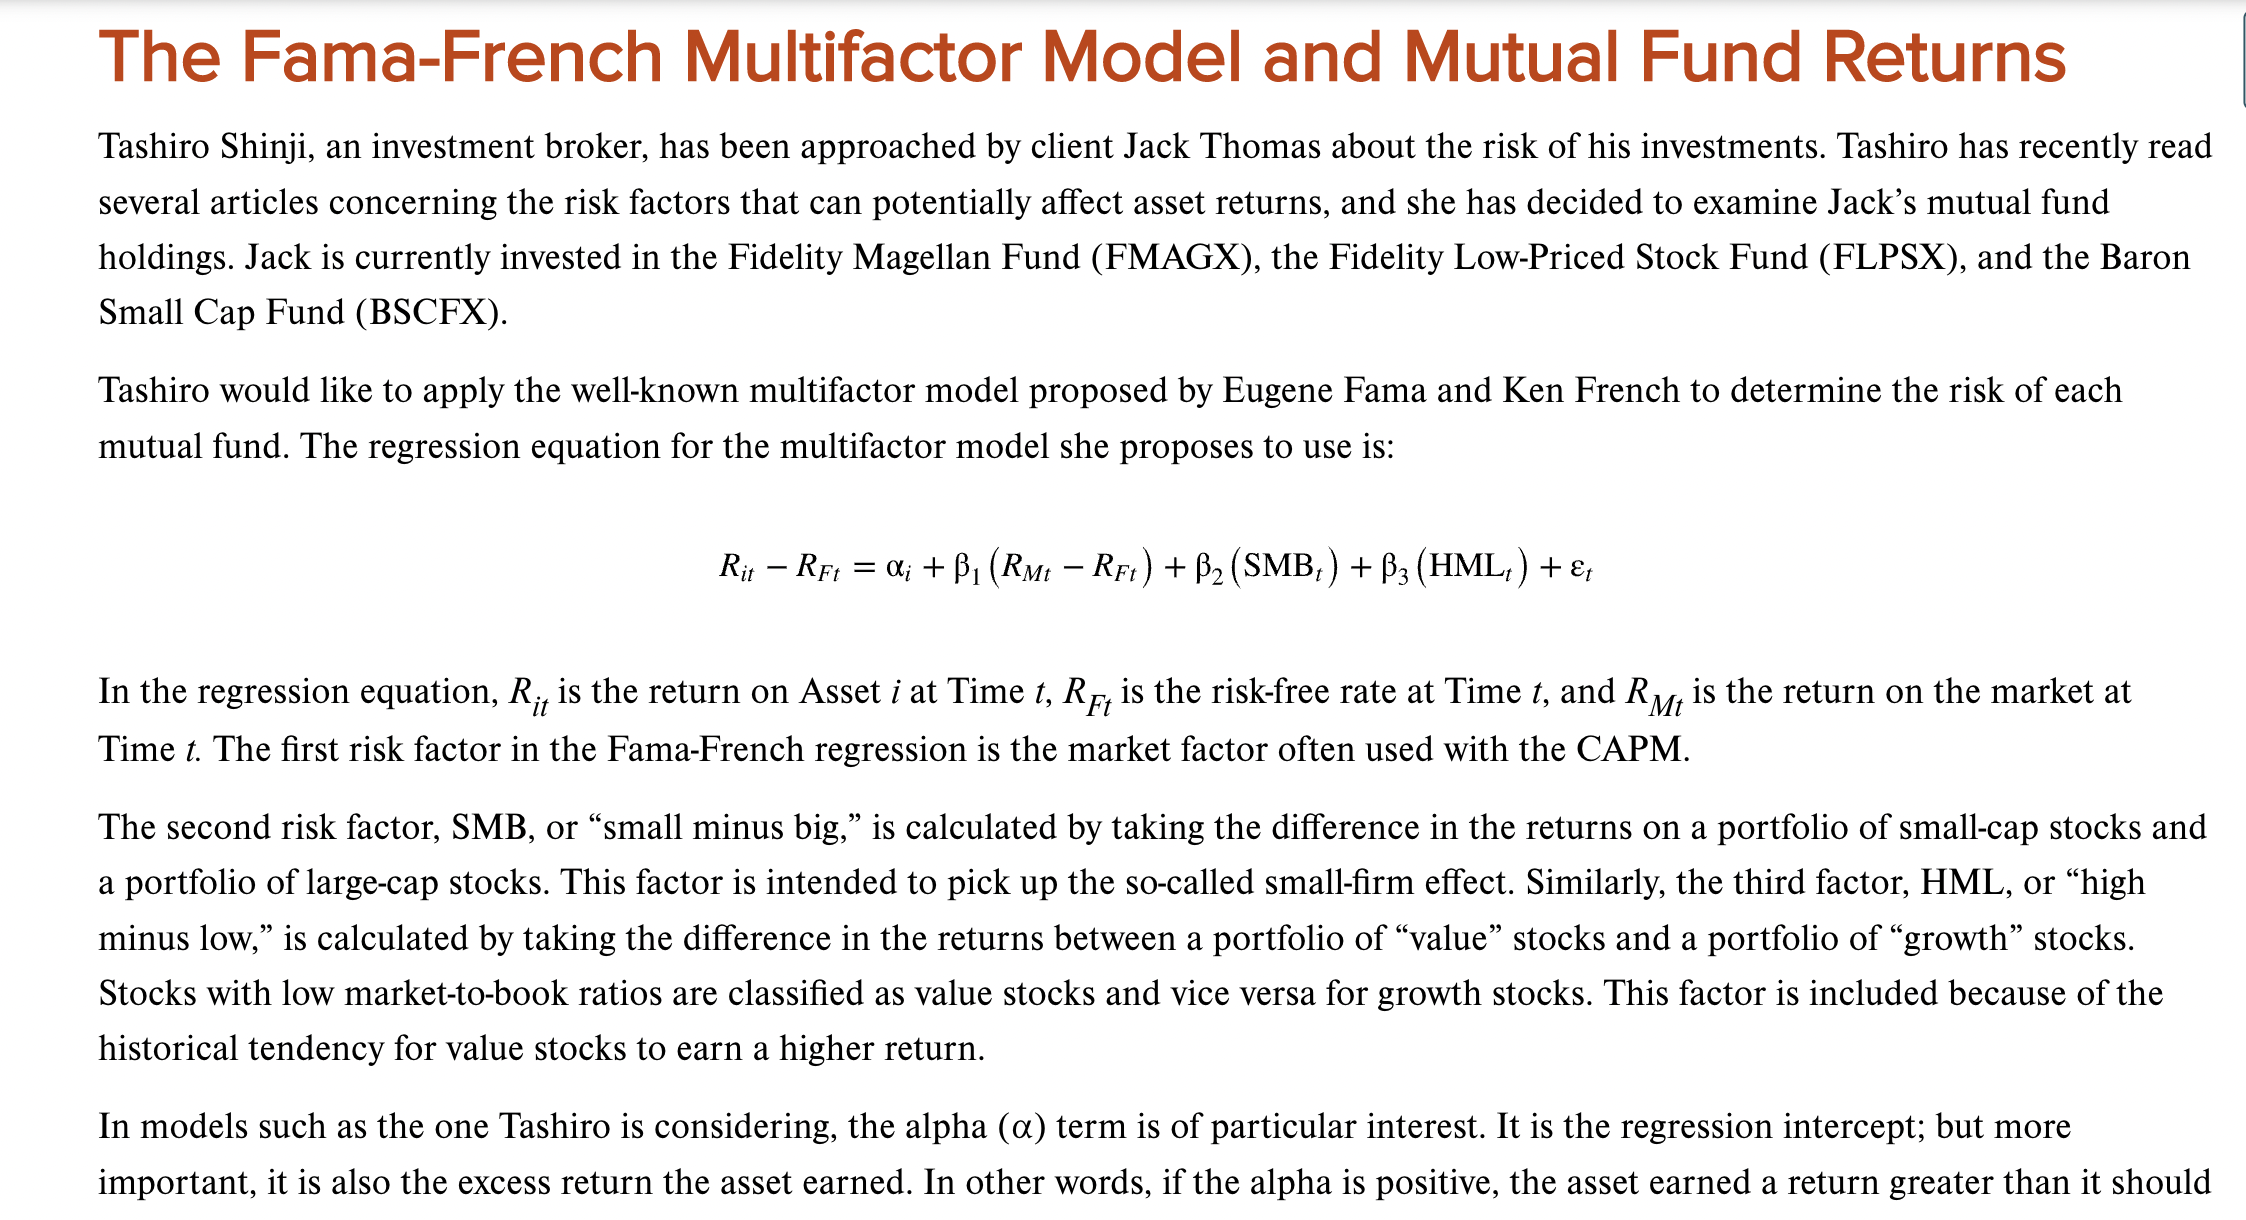
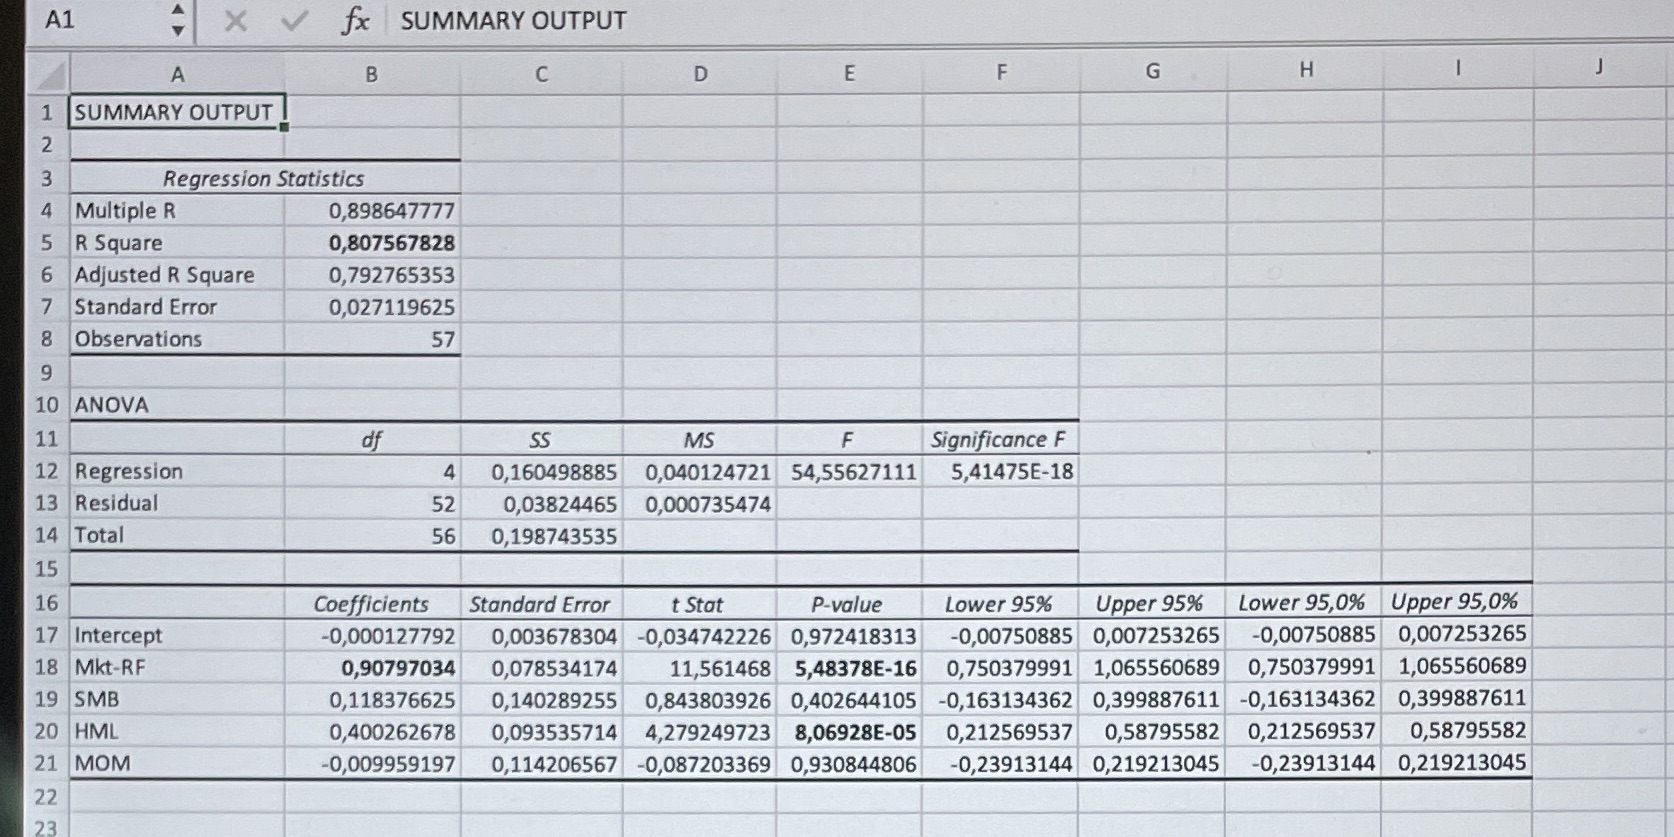
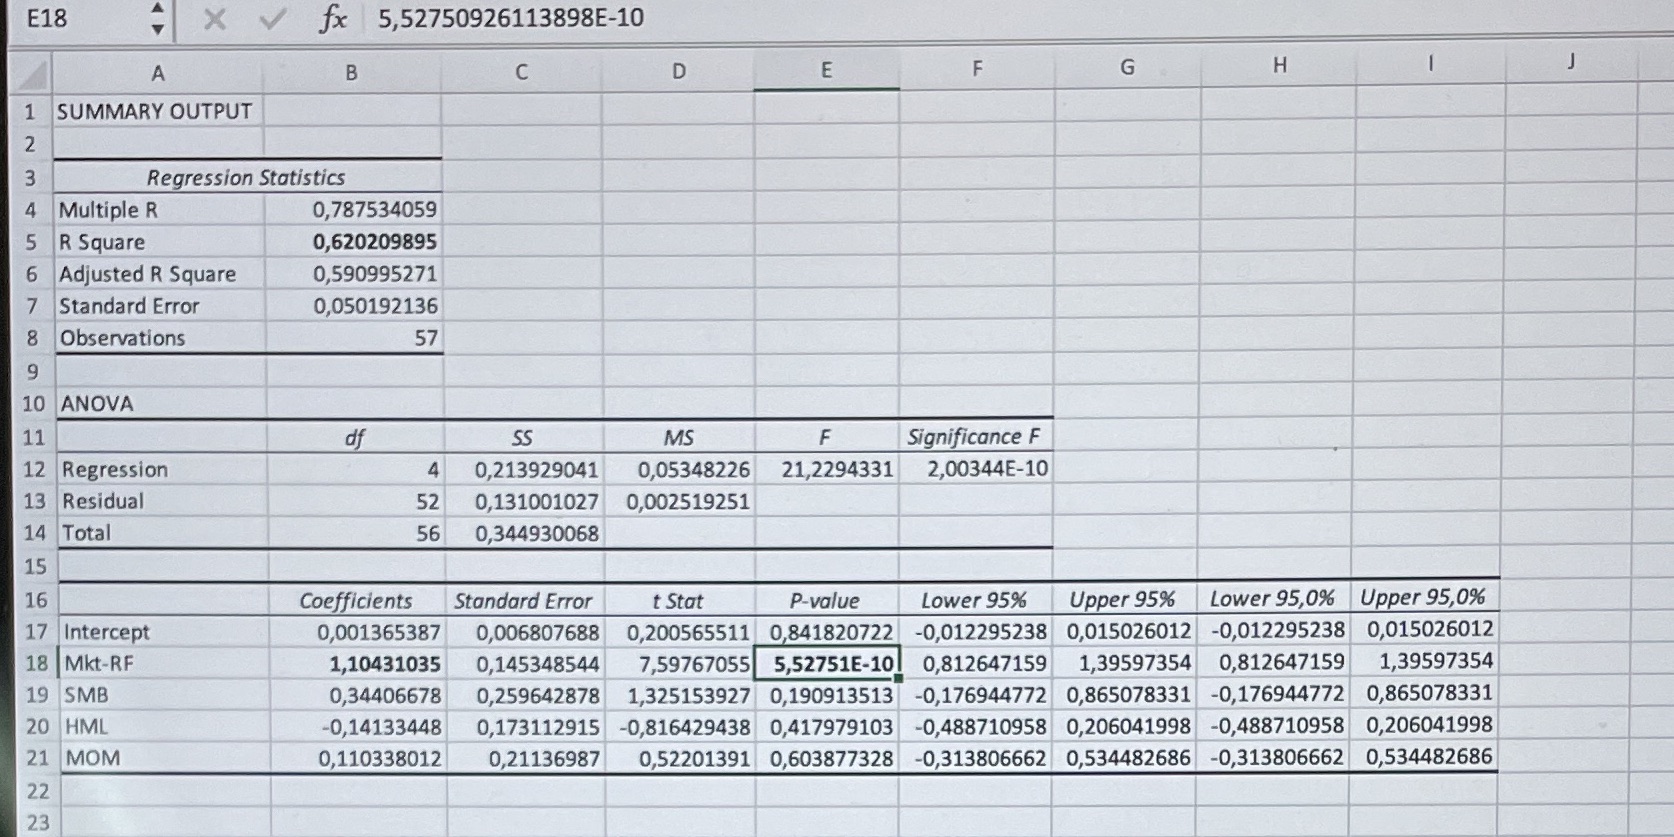
B U VVA E v v % 9 00 -20 E29 X V fx A B C D E F G H 1 SUMMARY OUTPUT W N Regression Statistics 4 Multiple R 0,878417396 5 R Square 0,771617122 6 Adjusted R Square 0,754049208 7 Standard Error 0,032780425 8 Observations 57 9 10 ANOVA 11 SS MS F Significance F 12 Regression 4 0,188786447 0,047196612 43,92195537 4,45402E-16 13 Residual +2 0,055876925 0,001074556 14 Total 56 0,244663371 15 16 Coefficients Standard Error t Stat P-value Lower 95% Upper 95% Lower 95,0% Upper 95,0% 17 Intercept -0,001049564 0,004446093 -0,236064402 0,814310049 -0,009971302 0,007872174 -0,009971302 0,007872174 18 Mkt-RF 1,055525633 0,094926962 11,11934489 2,34774E-15 0,865040748 1,246010519 0,865040748 1,246010519 19 SMB -0,370442195 0,169572457 -2,184565828 0,033451773 -0,710714225 -0,030170166 -0,710714225 -0,030170166 20 HML -0,475842699 0,113059841 -4,208768527 0,000101872 -0,702713866 -0,248971531 -0,702713866 -0,248971531 21 MOM 0,005817729 0,138045412 0,042143591 0,966545637 -0,271190656 0,282826115 -0,271190656 0,282826115 22 23A1 X V fx SUMMARY OUTPUT A B C D E F G H L P SUMMARY OUTPUT N W Regression Statistics 4 Multiple R 0,898647777 5 R Square 0,807567828 6 Adjusted R Square 0,792765353 7 Standard Error 0,027119625 8 Observations 57 9 10 ANOVA 11 of SS MS F Significance F 12 Regression 4 0,160498885 0,040124721 54,55627111 5,41475E-18 13 Residual 52 0,03824465 0,000735474 14 Total 56 0,198743535 15 16 Coefficients Standard Error t Stat P-value Lower 95% Upper 95% Lower 95,0% Upper 95,0% 17 Intercept -0,000127792 0,003678304 -0,034742226 0,972418313 -0,00750885 0,007253265 -0,00750885 0,007253265 18 Mkt-RF 0,90797034 0,078534174 11,561468 5,48378E-16 0,750379991 1,065560689 0,750379991 1,065560689 19 SMB 0,118376625 0,140289255 0,843803926 0,402644105 -0,163134362 0,399887611 -0,163134362 0,399887611 20 HML 0,400262678 0,093535714 4,279249723 8,06928E-05 0,212569537 0,58795582 0,212569537 0,58795582 21 MOM -0,009959197 0,114206567 -0,087203369 0,930844806 -0,23913144 0,219213045 -0,23913144 0,219213045 22 23E18 X V fx 5,52750926113898E-10 A B C D E F G H L 1 SUMMARY OUTPUT N W Regression Statistics 4 Multiple R 0,787534059 5 R Square 0,620209895 6 Adjusted R Square 0,590995271 7 Standard Error 0,050192136 8 Observations 57 9 10 ANOVA 11 df SS MS F Significance F 12 Regression 4 0,213929041 0,05348226 21,2294331 2,00344E-10 13 Residual 52 0,131001027 0,002519251 14 Total 56 0,344930068 15 16 Coefficients Standard Error t Stat P-value Lower 95% Upper 95% Lower 95,0% Upper 95,0% 17 Intercept 0,001365387 0,006807688 0,200565511 0,841820722 -0,012295238 0,015026012 -0,012295238 0,015026012 18 Mkt-RF 1,10431035 0,145348544 7,59767055 5,52751E-101 0,812647159 1,39597354 0,812647159 1,39597354 19 SMB 0,34406678 0,259642878 1,325153927 0,190913513 -0,176944772 0,865078331 -0,176944772 0,865078331 20 HML -0,14133448 0,173112915 -0,816429438 0,417979103 -0,488710958 0,206041998 -0,488710958 0,206041998 21 MOM 0,110338012 0,21136987 0,52201391 0,603877328 -0,313806662 0,534482686 -0,313806662 0,534482686 22 23The second risk factor, SMB, or \"small minus big,\" is calculated by taking the difference in the returns on a portfolio of smallcap stocks and L a portfolio of large-cap stocks. This factor is intended to pick up the so-called small-rm effect. Similarly, the third factor, HML, or \"high minus low,\" is calculated by taking the difference in the returns between a portfolio of \"value\" stocks and a portfolio of \"growth\" stocks. Stocks with low market-to-book ratios are classied as value stocks and vice versa for growth stocks. This factor is included because of the historical tendency for value stocks to earn a higher return. In models such as the one Tashiro is considering, the alpha (0!) term is of particular interest. It is the regression intercept; but more important, it is also the excess return the asset earned. In other words, if the alpha is positive, the asset earned a return greater than it should have given its level of risk; if the alpha is negative, the asset earned a return lower than it should have given its level of risk. This measure is called \"Jensen's alpha,\" and it is a widely used tool for mutual fund evaluation. 1. For a large-company stock mutual fund, would you expect the betas to be positive or negative for each of the factors in a Fama Page 392 French multifactor model? 2. The Fama-French factors and risk-free rates are available at Ken French's website: www.dartmouth.edu/ ~ kfrench. Download the monthly factors and save the most recent 60 months for each factor. The historical prices for each of the mutual funds can be found on various websites, including nance.yahoo.com. Find the prices of each mutual fund for the same time as the Fama-French factors and calculate the returns for each month. Be sure to include dividends. For each mutual fund, estimate the multifactor regression equation using the Fama-French factors. How well do the regression estimates explain the variation in the return of each mutual fund? 3. What do you observe about the beta coefcients for the different mutual funds? Comment on any similarities or differences. 4. If the market is efcient, what value would you expect for alpha? Do your estimates support market eiciency? 5. Which fund has performed best considering its risk? Why? The Fame-French Multifactor Model and Mutual Fund Returns Tashiro Shinji, an investment broker, has been approached by client Jack Thomas about the risk of his investments. Tashiro has recently read several articles concerning the risk factors that can potentially affect asset returns, and she has decided to examine Jack's mutual fund holdings. Jack is currently invested in the Fidelity Magellan Fund (FMAGX), the Fidelity Low-Priced Stock Fund (FLPSX), and the Baron Small Cap Fund (BSCFX). Tashiro would like to apply the well-known multifactor model proposed by Eugene Fama and Ken French to determine the risk of each mutual fund. The regression equation for the multifactor model she proposes to use is: R\" RF; 2 (Xi +1
Step by Step Solution
There are 3 Steps involved in it

Get step-by-step solutions from verified subject matter experts