Question: Hello, Below attached is a statistics lesson. Please solve when possible. Answer will be rated immediately. Thank you so much. Now, to determine how well

Hello,

Below attached is a statistics lesson. Please solve when possible. Answer will be rated immediately. Thank you so much.Hello, Below attached is a statistics lesson.

Now, to determine how well correlated these two variables are, we must calculate a Correlation coefficient, "r" using these (X,Y) data values (Do you see all the the "SQUARED" values? This should remind you of the way we calculated the variance by squaring distances from the mean to get positive values. That is basically the purpose here as well) Here is the formula used to calculate the CORRELATION COEFFICIENT " It's basically a measure of the combined variance bewteen the two data sets (NO probability factor involved) r-values can range from 0.00 (0% = no correlation) to 1.00 (100% = perfect linear correlation). The higher the r-value the better the correlation (but proving nothing by itself) r=[n* (**Y) (EX) * (EY)] / V{[n * Ex- (EX)?] * [n* zy? - (EY)21} where n = 6 pairs of data X2 Y^2 (X*Y) 5 7 3 7 9 5 11 16 13 10 14 20 72 48 1.00, yes, r can be negative) 9) The COEFFICIENT OF DETERMINATION = P2, is also a percentage meaning that this % of the variation in "Y" is explained by the variation in "X" Herer = and (100% - p2 %) = 10) Your Conclusion: Based on the r and r2 values you calculated, how confident are you that there indeed could be a relationship? (Explain)

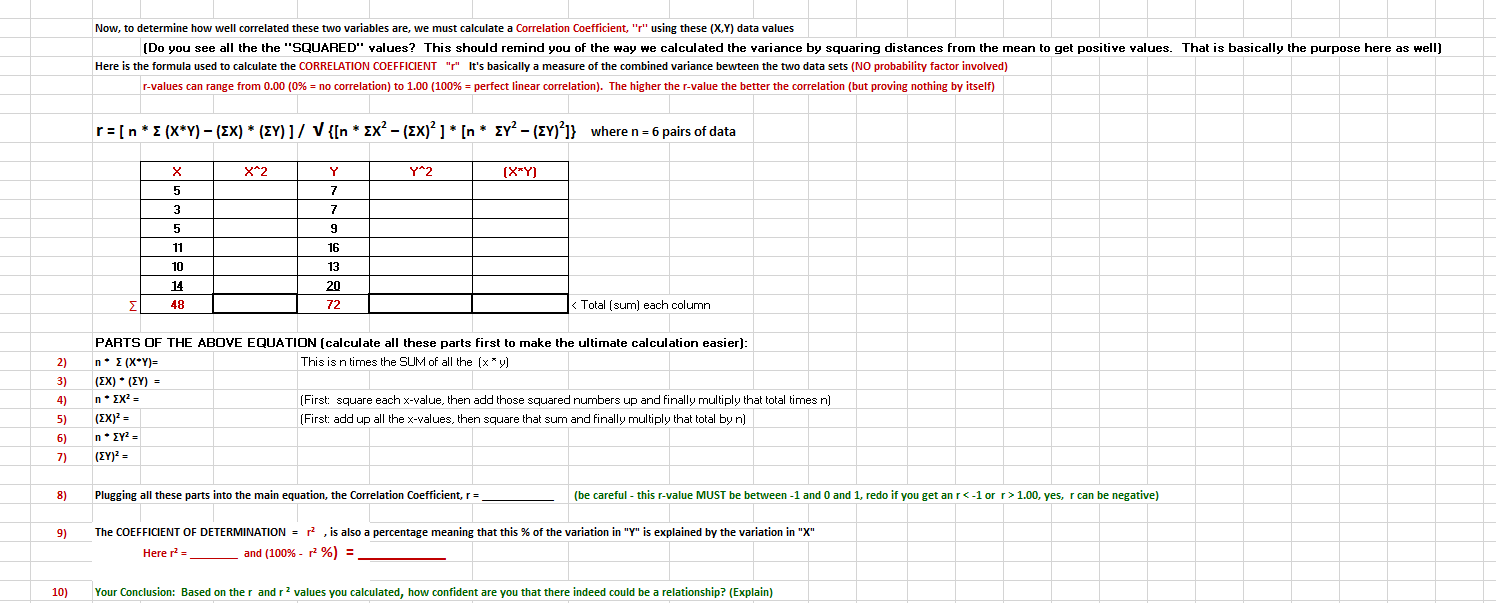
Step by Step Solution

There are 3 Steps involved in it

1 Expert Approved Answer
Step: 1 Unlock blur-text-image
Question Has Been Solved by an Expert!

Get step-by-step solutions from verified subject matter experts

Step: 2 Unlock
Step: 3 Unlock

Students Have Also Explored These Related General Management Questions!