

Question: hello can anyone please help!!! material to answer attached thank you very much!!! hello can you just answer part A please!!!! Sensitivity Part A: Financial
hello can anyone please help!!! material to answer attached thank you very much!!!
hello can you just answer part A please!!!!
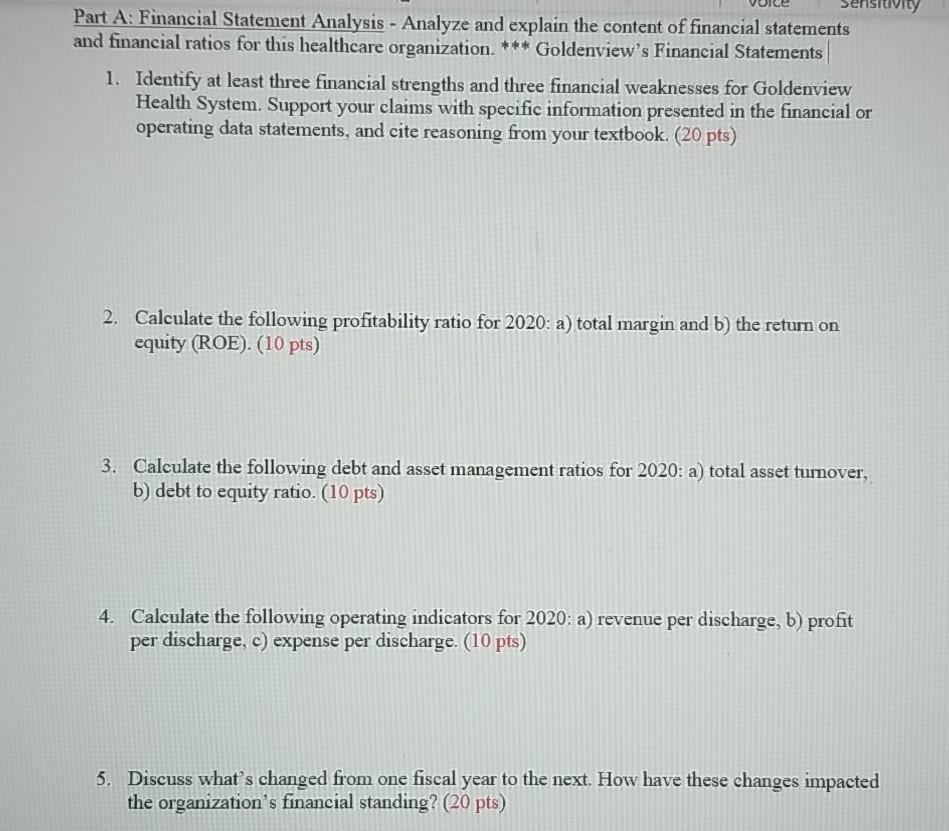
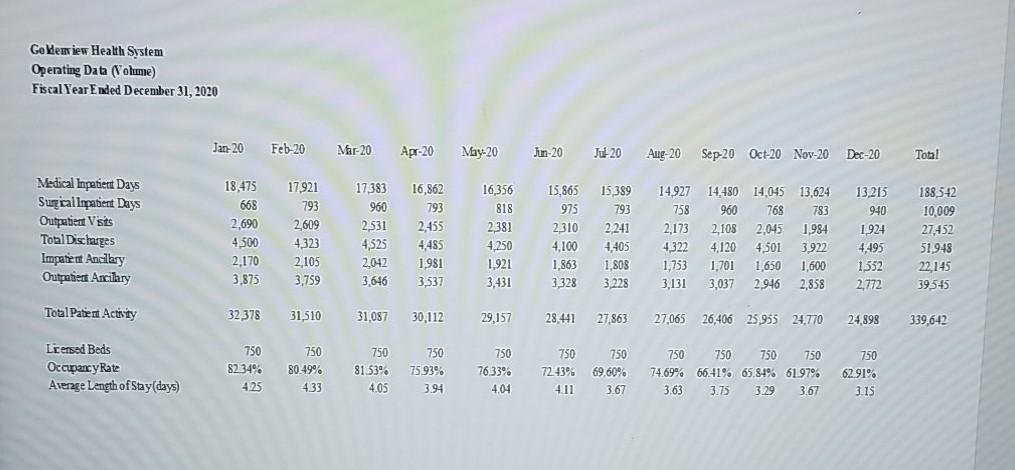
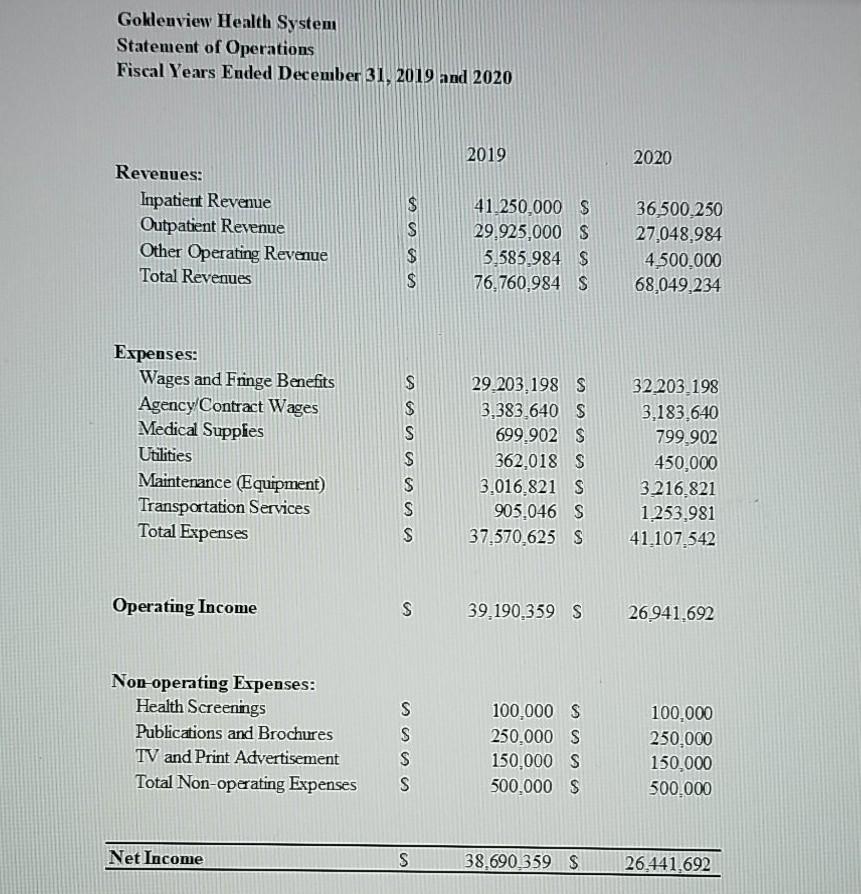
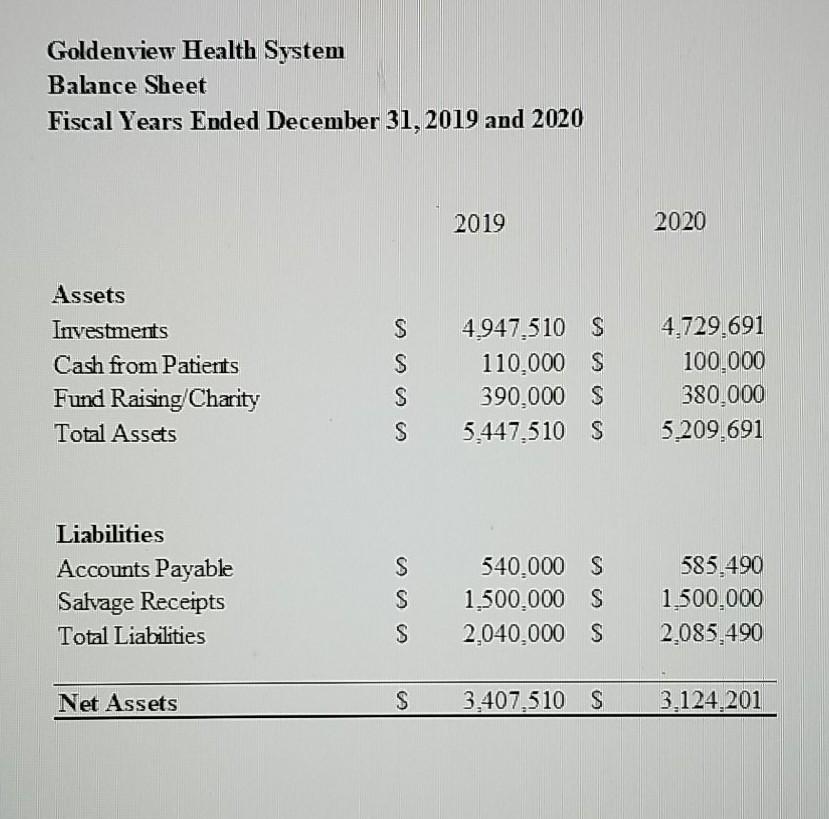
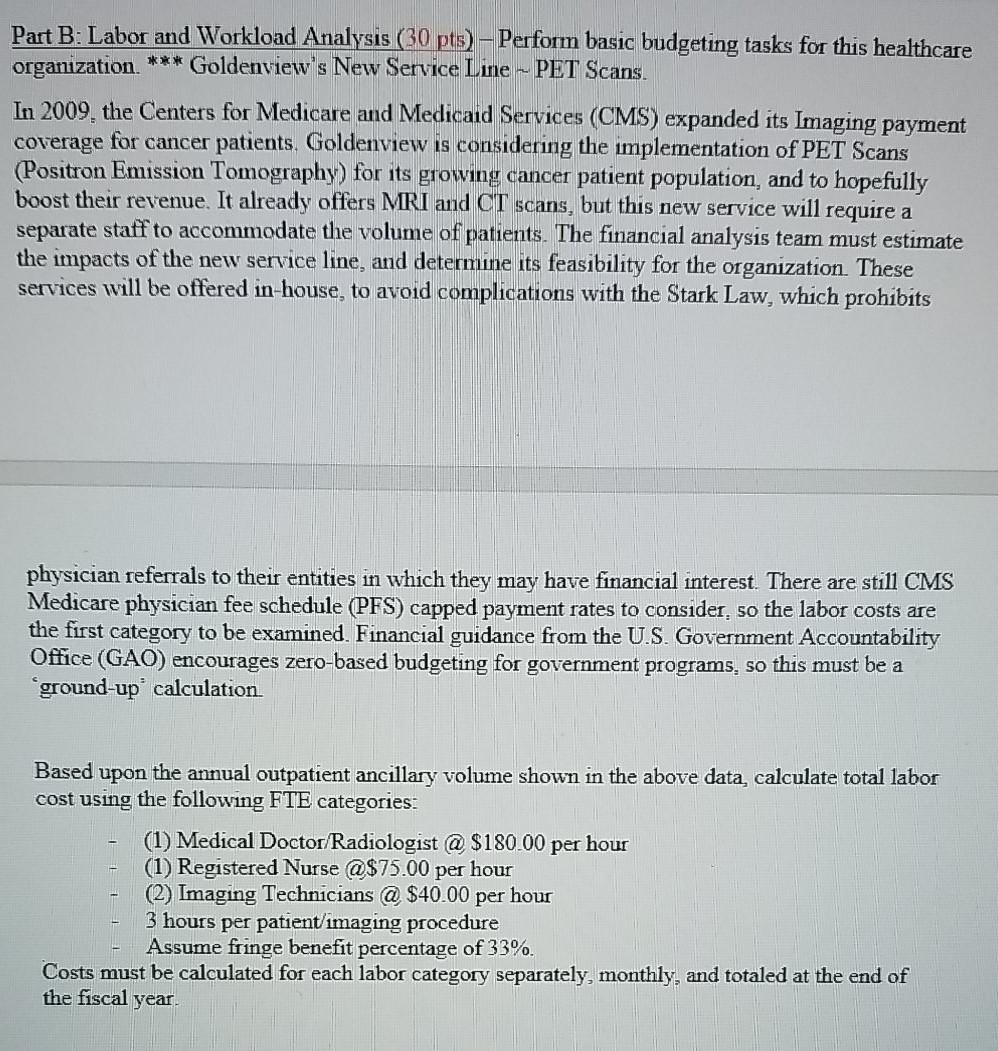
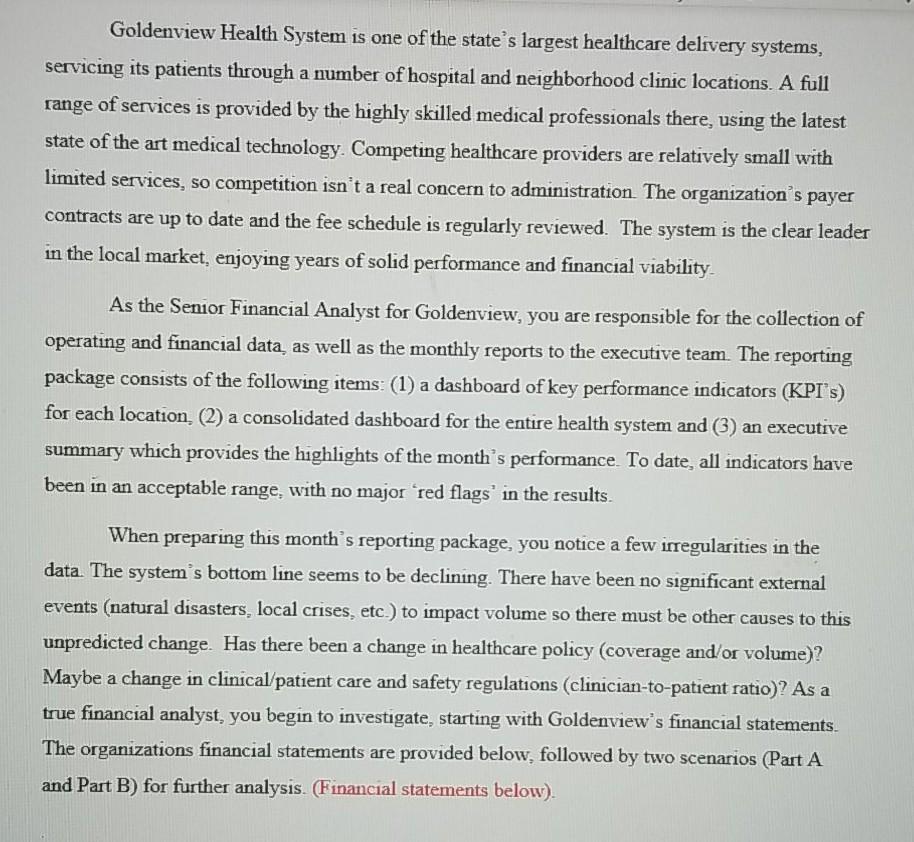
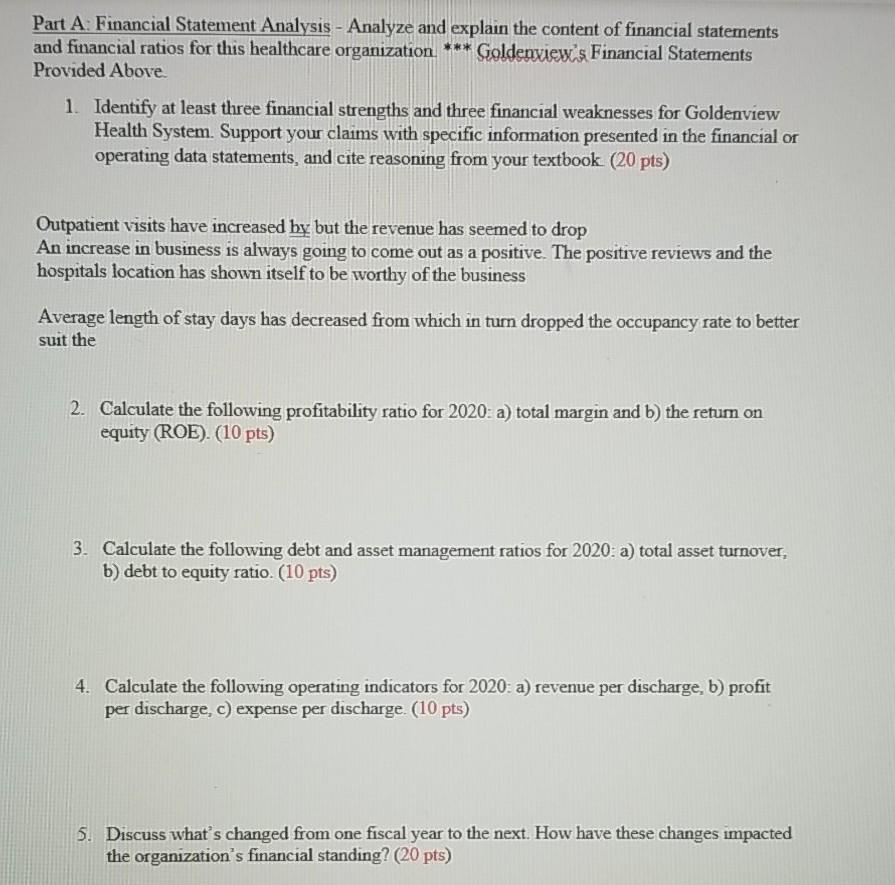
Sensitivity Part A: Financial Statement Analysis - Analyze and explain the content of financial statements and financial ratios for this healthcare organization. *** Goldenview's Financial Statements 1. Identify at least three financial strengths and three financial weaknesses for Goldenview Health System. Support your claims with specific information presented in the financial or operating data statements, and cite reasoning from your textbook. (20 pts) 2. Calculate the following profitability ratio for 2020: a) total margin and b) the return on equity (ROE). (10 pts) 3. Calculate the following debt and asset management ratios for 2020: a) total asset turnover, b) debt to equity ratio. (10 pts) 4. Calculate the following operating indicators for 2020: a) revenue per discharge, b) profit per discharge, c) expense per discharge. (10 pts) 5. Discuss what's changed from one fiscal year to the next. How have these changes impacted the organization's financial standing? (20 pts) Go Weaview Health System Operating Data (Volume) Fiscal Year Ended December 31, 2020 Jan-20 Feb-20 Mar-20 Apr-20 May-20 Jin-20 J-20 Aug-20 Sep-20 Oct-20 Nov-20 Dec-20 Total Medical Inpatient Days Surgical Inpatient Days Outpatient Visits Total Discharges Impatient Ancillary Outpatient Ancillary 18,475 17,921 668 793 2,690 2,609 4500 4323 2,170 2,105 3,875 3,759 17383 960 2531 4525 2,042 3.646 16,862 793 2,455 4,485 1,981 16,356 15,865 15,389 14.927 14,480 14,045 13,624 13,215 818 975 793 758 960 768 783 940 2,381 2310 2.241 2,173 2.108 2.045 1,984 1924 4,250 4,100 4,405 4.322 4,120 4,501 3922 4,495 1.921 1,863 1,808 1,753 1,701 1,650 1,600 1352 3,431 3.328 3,228 3,1313,037 2.946 2,858 2,772 188542 10,009 27,452 51,948 22.145 39545 3,537 TotalPatient Actity 32 378 31,510 31,087 30,112 29,157 28,441 27,863 27,065 26,406 25.955 24,770 24,898 339,642 Licensed Beds Occupar y Rate Average Length of Stay(days) 750 750 82.34% 80.49% 425 4.33 750 750 81.53% 7593% 4.05 3.94 750 7633% 4.04 750 750 750 750 750 750 72.43% 69,60% 74.69% 66.41% 65.84% 61.97% 4.11 3.67 3.63 375 3.29 3.67 750 62.91% 3.15 Goklenview Health System Statement of Operations Fiscal Years Ended December 31, 2019 and 2020 2019 2020 Revenues: Inpatient Reveme Outpatient Revenue Other Operating Revenue Total Revenues $ S 41.250,000 $ 29.925,000 S 5.585.984 S 76,760,984 S 36,500 250 27,048,984 4.500.000 68,049,234 $ S Expenses: Wages and Fringe Benefits Agency Contract Wages Medical Supplies Utilities Maintenance Equipment) Transportation Services Total Expenses $ S S $ S S 29.203.198 S 3,383,640 S 699.902 S 362,018 S 3.016.821 S 905.046 S 37,570,625 S 32 203.198 3,183,640 799.902 450,000 3216.821 1.253,981 41.107.542 Operating Income S 39.190.359 S 26,941,692 Non operating Expenses: Health Screenings Publications and Brochures TV and Print Advertisement Total Non-operating Expenses S S s S 100.000 S 250.000 S 150,000 S 500.000 S 100,000 250.000 150,000 500.000 Net Income S CA 38.690.359 $ 26,441,692 Goldenview Health System Balance Sheet Fiscal Years Ended December 31, 2019 and 2020 2019 2020 Assets Investments Cash from Patients Fund Raising/Charity Total Assets S S S S 4.947.510 S 110,000 S 390,000 S 5,447,510 S 4,729.691 100.000 380,000 5.209.691 Liabilities Accounts Payable Salvage Receipts Total Liabilities S S S 540,000 $ 1.500.000 S 2,040,000 S 585.490 1,500,000 2,085,490 Net Assets S 3,407,510 S 3.124,201 Part B: Labor and Workload Analysis (30 pts) - Perform basic budgeting tasks for this healthcare organization *** Goldenview's New Service Line - PET Scans In 2009, the Centers for Medicare and Medicaid Services (CMS) expanded its Imaging payment coverage for cancer patients. Goldenview is considering the implementation of PET Scans (Positron Emission Tomography) for its growing cancer patient population, and to hopefully boost their revenue. It already offers MRI and CT scans, but this new service will require a separate staff to accommodate the volume of patients. The financial analysis team must estimate the impacts of the new service line, and determine its feasibility for the organization. These services will be offered in-house, to avoid complications with the Stark Law, which prohibits physician referrals to their entities in which they may have financial interest. There are still CMS Medicare physician fee schedule (PFS) capped payment rates to consider, so the labor costs are the first category to be examined. Financial guidance from the U.S. Government Accountability Office (GAO) encourages zero-based budgeting for government programs, so this must be a 'ground-up calculation Based upon the annual outpatient ancillary volume shown in the above data, calculate total labor cost using the following FTE categories: (1) Medical Doctor Radiologist @ $180.00 per hour (1) Registered Nurse @$75.00 per hour (2) Imaging Technicians @ $40.00 per hour 3 hours per patient/imaging procedure Assume fringe benefit percentage of 33%. Costs must be calculated for each labor category separately, monthly, and totaled at the end of the fiscal year Goldenview Health System is one of the state's largest healthcare delivery systems, servicing its patients through a number of hospital and neighborhood clinic locations. A full range of services is provided by the highly skilled medical professionals there, using the latest state of the art medical technology Competing healthcare providers are relatively small with limited services, so competition isn't a real concern to administration The organization's payer contracts are up to date and the fee schedule is regularly reviewed. The system is the clear leader in the local market, enjoying years of solid performance and financial viability As the Senior Financial Analyst for Goldenview, you are responsible for the collection of operating and financial data, as well as the monthly reports to the executive team. The reporting package consists of the following items: (1) a dashboard of key performance indicators (KPI's) for each location, (2) a consolidated dashboard for the entire health system and (3) an executive summary which provides the highlights of the month's performance. To date, all indicators have been in an acceptable range, with no major red flags' in the results. When preparing this month's reporting package, you notice a few irregularities in the data. The system's bottom line seems to be declining. There have been no significant external events (natural disasters, local crises, etc.) to impact volume so there must be other causes to this unpredicted change. Has there been a change in healthcare policy (coverage and/or volume)? Maybe a change in clinical/patient care and safety regulations (clinician-to-patient ratio)? As a true financial analyst, you begin to investigate, starting with Goldenview's financial statements. The organizations financial statements are provided below, followed by two scenarios (Part A and Part B) for further analysis. (Financial statements below) Part A: Financial Statement Analysis - Analyze and explain the content of financial statements and financial ratios for this healthcare organization *** Goldenviews Financial Statements Provided Above 1. Identify at least three financial strengths and three financial weaknesses for Goldenview Health System. Support your claims with specific information presented in the financial or operating data statements, and cite reasoning from your textbook (20 pts) Outpatient visits have increased by but the revenue has seemed to drop An increase in business is always going to come out as a positive. The positive reviews and the hospitals location has shown itself to be worthy of the business Average length of stay days has decreased from which in turn dropped the occupancy rate to better suit the 2. Calculate the following profitability ratio for 2020: a) total margin and b) the retum on equity (ROE) (10 pts) 3. Calculate the following debt and asset management ratios for 2020: a) total asset turnover, b) debt to equity ratio. (10 pts) 4. Calculate the following operating indicators for 2020: a) revenue per discharge, b) profit per discharge, C) expense per discharge. (10 pts) 5. Discuss what's changed from one fiscal year to the next. How have these changes impacted the organization's financial standing? (20 pts)
Step by Step Solution
There are 3 Steps involved in it

Get step-by-step solutions from verified subject matter experts