

Question: Hello! Can I get assistance with these Operating Systems Gantt Chart calculations? This is due very soon (in two hours) so I hope you can
Hello! Can I get assistance with these Operating Systems Gantt Chart calculations? This is due very soon (in two hours) so I hope you can get back to me quickly. I already did the Gantt Chart for the given MLFQ process, as well as the waiting times (WT), but I need the Response Times (RT), and the Turnaround Times (TT) for each Process. As well as the averages. Thanks!
The Gantt Chart I made:
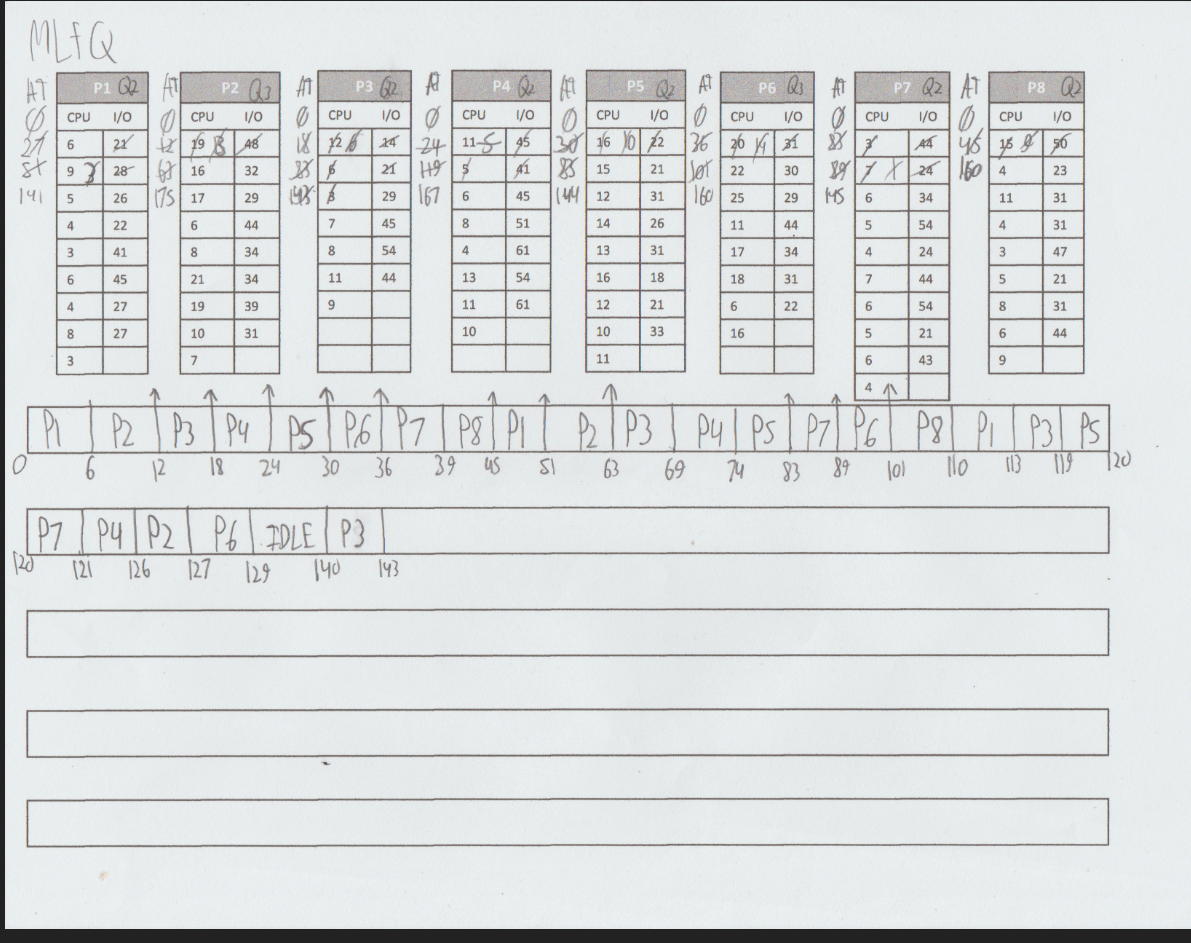
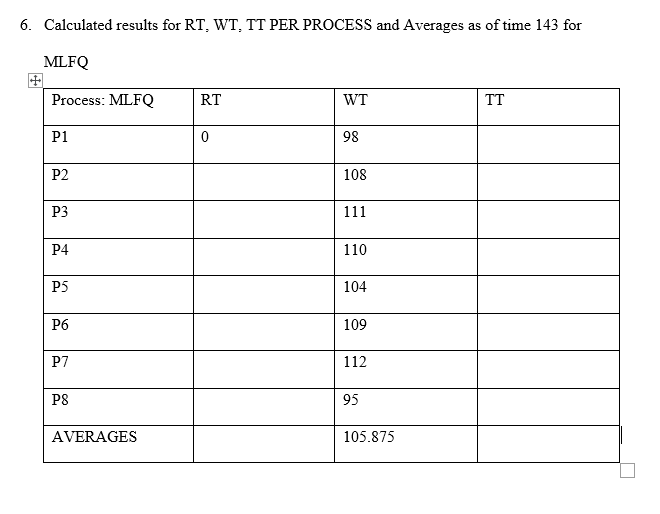
6. Calculated results for RT, WT, TT PER PROCESS and Averages as of time 143 for MLFQ Process: MLFQ RT WT TT P1 0 98 P2 108 P3 111 P4 110 P5 104 P6 109 P7 112 P8 95 AVERAGES 105.875 MLAQ A1 P1 Q2 CPU 1/0 2x 41 P3 (2 0 CPU 1/0 18 16 14 $16 21 6 P2 Q3 0 CPU 1/0 19 48 6716 175 17 6 PA Q A - P5 Q2 CPU 1/0 0 CPU I/O 24 115 45 30 76 10 22 195 41 $ 15 1676 (4412 AT P6 Q3 AT P7 Q2 AT P8 Q2 0 CPU 1/0 0 CPU 1700 CPU 1/0 36 30 31 258 so Jol 22 1804 16025 29 1456 44 97/28 32 21 30 23 141 5 26 29 29 45 31 34 11 31 4 22 44 7 45 8 51 14 26 11 44 5 54 4 31 - 3 41 8 34 8 54 4 61 13 31 17 34 4 24 3 47 6 45 21 34 11 44 13 54 16 18 18 31 7 44 5 21 4 27 19 39 9 11 61 12 21 6 22 6 54 8 31 8 27 10 31 10 10 33 16 5 21 6 44 3 7 6 43 9 11 41 1 IPL P2 9 1 Pu 18 24 PS P6 P7 P8 PL P2 P3 Pu Ps P7 P6 P8 P1P3 PS 63 69 24 83 89 Jol llo 19 O 12 30 36 39 US SI 120 1P7 P4P2P IDLE P3 1225 121 126 127 129 140 193
Step by Step Solution
There are 3 Steps involved in it

Get step-by-step solutions from verified subject matter experts