

Question: Hello can I get in depth help on how to solve ? J . 4. The histogram below shows the weekly wages of workers at
Hello can I get in depth help on how to solve ?
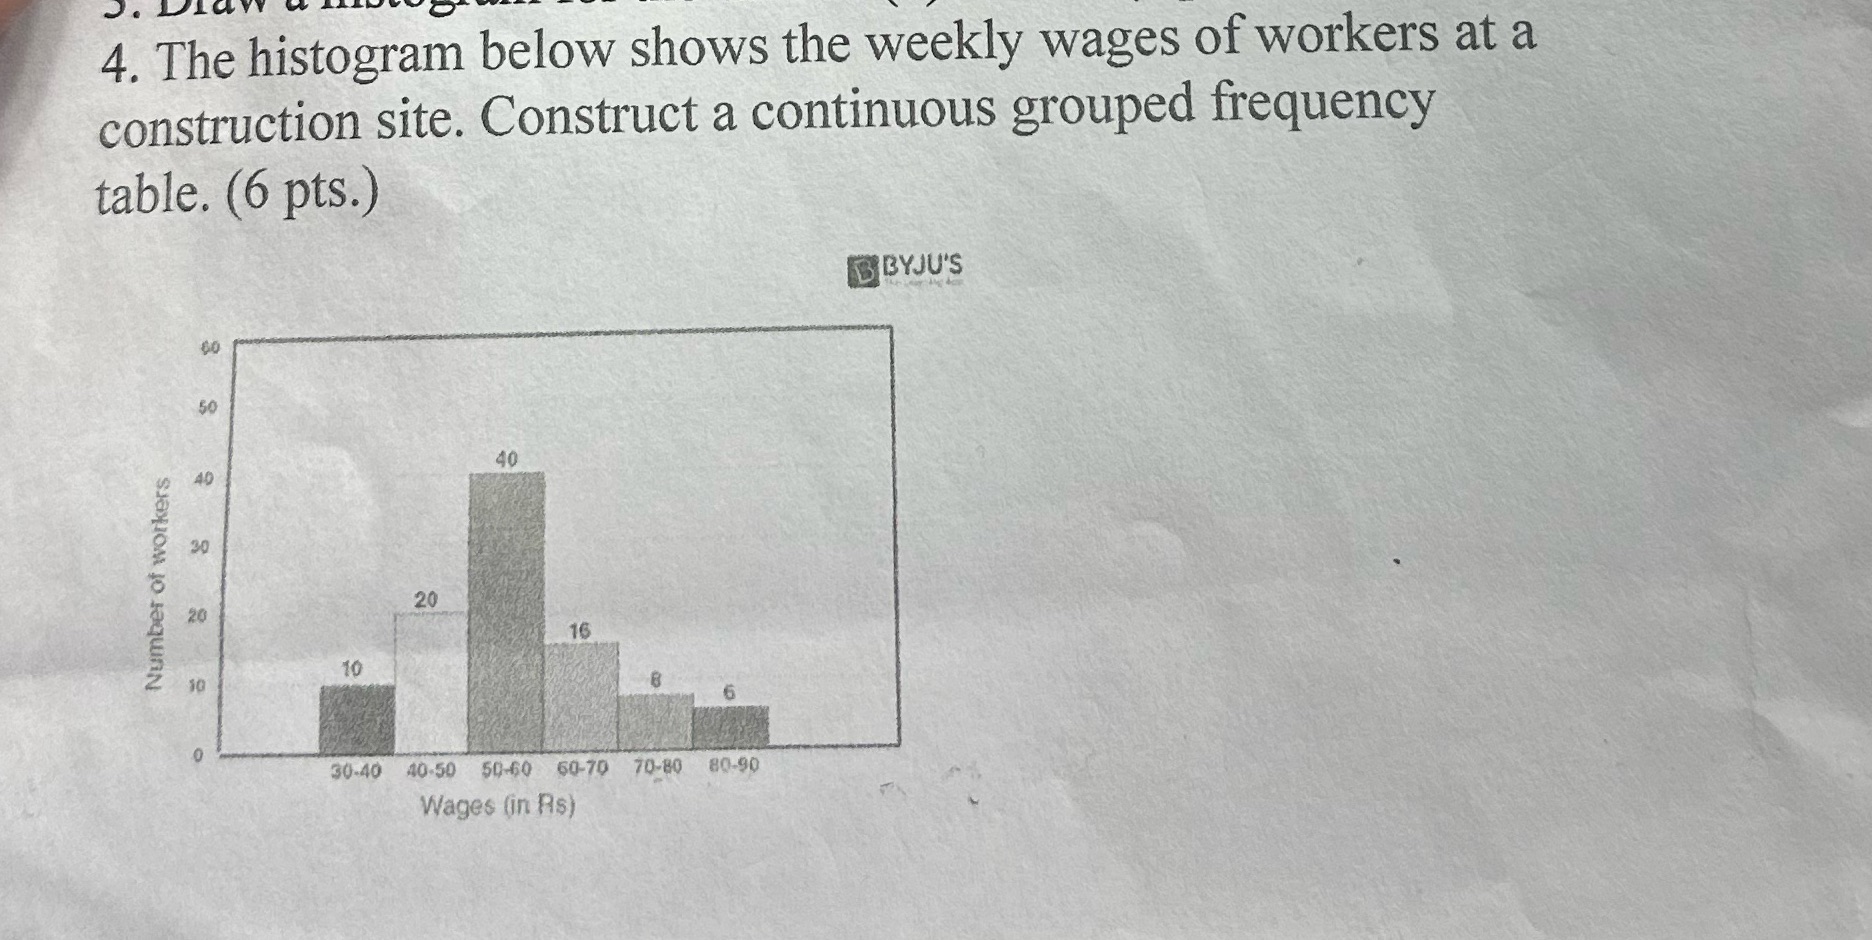
J . 4. The histogram below shows the weekly wages of workers at a construction site. Construct a continuous grouped frequency table. (6 pts.) B BY JU'S 60 50 40 30 Number of workers 20 20 16 10 10 30-40 40-50 50-60 60-70 70-80 80-90 Wages (in As)
Step by Step Solution
There are 3 Steps involved in it
1 Expert Approved Answer
Step: 1 Unlock

Question Has Been Solved by an Expert!
Get step-by-step solutions from verified subject matter experts
Step: 2 Unlock
Step: 3 Unlock