

Question: Hello can I please have help with this. 3. The table below shows the life expectancy for an individual born in the United States in
Hello can I please have help with this.
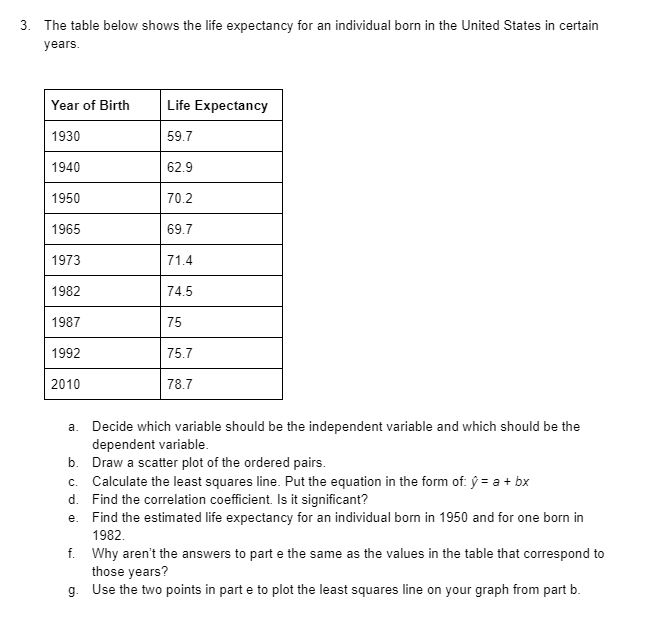
3. The table below shows the life expectancy for an individual born in the United States in certain veers. Year of Birth Life Expectancy 193D 99.]Ir 1949 92.9 1959 7'92 19195 99.? 19TH T14 1 9192 T115 1 93? 1 992 2919 a. Decide which variable should he the independent variable and which should he the dependent variable. i]. Draw a scatter plot of the ordered pairs. c. Calculate the least squares line. Put the equation in the form of: 3.? = a + to: d. Find the correlation coefcient Is it signicant? e. Find the estimated life expectancv for an individual hon'l in 1959 and for one bom in 1932. t. Whv aren't the answers to part e the same as the values in the table that correspond to those years? 9. Use the two points in parte to plot the lea st squares line on your graph from part i]
Step by Step Solution
There are 3 Steps involved in it

Get step-by-step solutions from verified subject matter experts