

Question: Hello, can someone help me with this assignment? D A 1 Rainbow Paint Co.'s comparative financial statements for the years ending December 31 2 2014
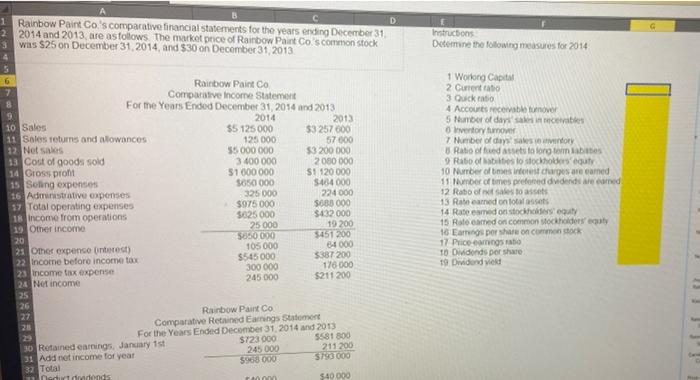
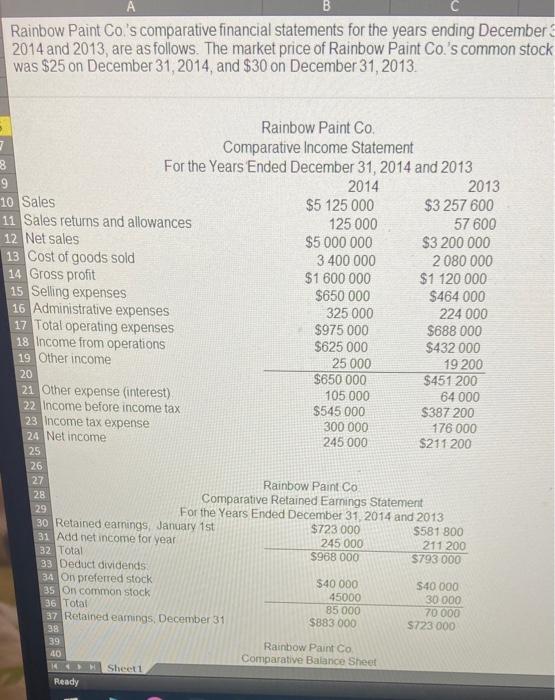
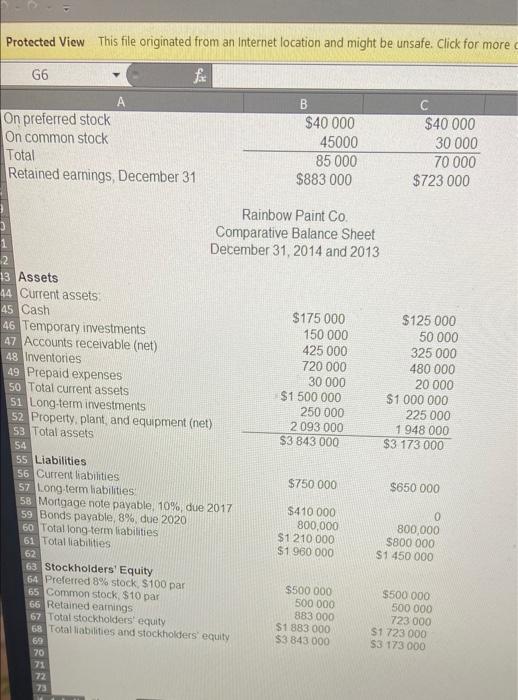
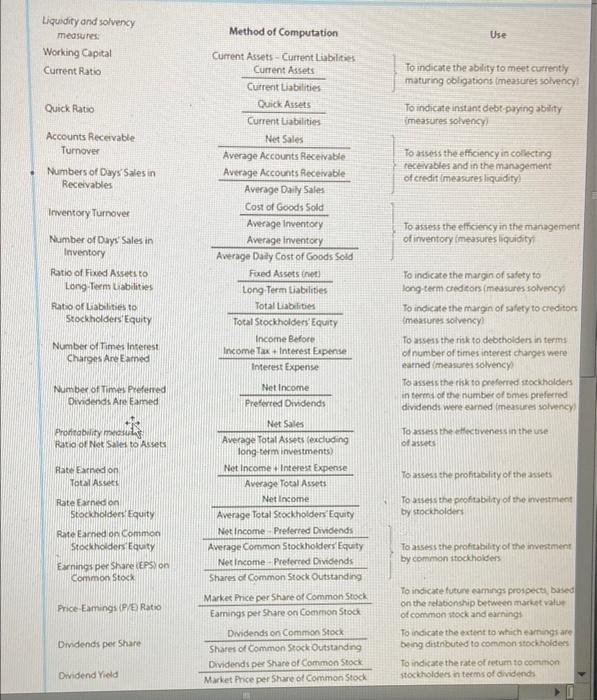
D A 1 Rainbow Paint Co.'s comparative financial statements for the years ending December 31 2 2014 and 2013, are as follows the market price of Rainbow Paint Co.'s common stock 3 was $25 on December 31, 2014, and $30 on December 31, 2013 Instructions Determine the following measures for 2014 Rainbow Paint Co 7 Comparative Income Statement 8 Forme Years Ended December 31, 2014 and 2013 9 2014 10 Sales 2013 $5 125 000 $3257600 11 Sales returns and allowances 125 000 57600 12 Net Sales 55 000 000 $3200 000 13 Cost of goods sold 3 400 000 2080 000 14 Gross pront 51 000 000 S! 120 000 15 Soling expenses 5650 000 5484000 16 Administrative expenses 325 000 224 000 19 Total operating expenses $975 000 5683 000 18 income from operations $625 000 $432000 19 Other income 25 000 19 200 20 $850 000 $451200 23 Other expenso interest) 105 000 34000 22 Income before income tax $545000 3387 200 300 000 176 000 23 income tax expenser 24 Not income 245.000 $211 200 25 26 27 Rainbow Paint Co 25 Comparative Retained Earnings Statement For the Year Ended December 31, 2014 and 2013 $723 000 5581 800 30 Retained earnings, January 1st 245 000 211 200 31 Add net income for year 390 000 32 Total nadurtmands $40 000 1 Worlong Capital 2 Current 3 Quick ratio 4 Accounts receivable mover 5 Number of days since Inventory tumor 7 Number of days noty Ratio of bed assets to long tombo 9 Roof is to stockholders'uty 10 Number of times inforest charges are earned 11 Number of times preferred vidende 12 Ratio of us to assets 13 Ral medonossos 14 Rate eamed on stockholders gut 15 Rotored on common stockholders 16 Eags por sharon common 17 Price coming to 10 DMdonds per share 19 Dwidend ved A B Rainbow Paint Co.'s comparative financial statements for the years ending December 2014 and 2013, are as follows. The market price of Rainbow Paint Co.'s common stock was $25 on December 31, 2014, and $30 on December 31, 2013 Rainbow Paint Co. 7 Comparative Income Statement 8 For the Years Ended December 31, 2014 and 2013 9 2014 2013 10 Sales $5 125 000 $3 257 600 11 Sales returns and allowances 125 000 57 600 12 Net sales $5 000 000 $3 200 000 13 Cost of goods sold 3 400 000 2 080 000 14 Gross profit $1 600 000 $1 120 000 15 Selling expenses $650 000 $464 000 16 Administrative expenses 325 000 224 000 17 Total operating expenses $975 000 $688 000 18 Income from operations $625 000 $432 000 19 Other income 25 000 19 200 20 $650 000 $451 200 21 Other expense (interest) 105 000 64 000 22 Income before income tax $545 000 $387 200 23 Income tax expense 300 000 176 000 24 Net income 245 000 $211 200 25 26 Rainbow Paint Co 28 Comparative Retained Earnings Statement 29 For the Years Ended December 31, 2014 and 2013 30 Retained earings, January 1st $723 000 $581 800 31 Add net income for year 245 000 211 200 32 Total $968 000 $793 000 33 Deduct dividends 34 On preferred stock $40 000 $40 000 35 On common stock 45000 30 000 36 Total 85 000 70 000 37 Retained eamings December 31 $883 000 S723 000 38 39 Rainbow Paint Co 40 Comparative Balance Sheet Sheet1 Ready 27 14 Protected View This file originated from an Internet location and might be unsafe. Click for more G6 fa On preferred stock On common stock Total Retained earnings, December 31 B $40 000 45000 85 000 $883 000 $40 000 30 000 70 000 $723 000 Rainbow Paint Co. Comparative Balance Sheet December 31, 2014 and 2013 $175 000 150 000 425 000 720 000 30 000 $1 500 000 250 000 2 093 000 S3 843 000 $125 000 50 000 325 000 480 000 20 000 $1 000 000 225 000 1 948 000 $3 173 000 13 Assets 44 Current assets 45 Cash 46 Temporary investments 47 Accounts receivable (net) 48 Inventories 49 Prepaid expenses 50 Total current assets Si Long-term investments 52 Property, plant, and equipment (net) 53 Total assets 54 55 Liabilities 56 Current liabilities 57 Long term liabilities 58 Mortgage note payable, 10%, due 2017 59 Bonds payable 8%, due 2020 60 Total long term liabilities 61 Total liabilities 62 63 Stockholders' Equity 64 Preferred 8% stock. $ 100 par 65 Common stock $10 par 66 Retained earnings 67 Total stockholders' equity 68 Total liabilities and stockholders' equity 69 $750 000 $650 000 $410 000 800,000 $1 210 000 $1 960 000 0 800,000 $800 000 $1 450 000 $500 000 500 000 883 000 $1 883 000 $3 843 000 $500 000 500 000 723 000 51 723 000 S3 173 000 www 71 72 73 Method of Computation Use Liquidity and solvency measures Working Capital Current Ratio To indicate the ability to meet currently maturing obligations imeasures solvency! To indicate instant debt paying ability measures solvency Quick Ratio Accounts Receivable Turnover Numbers of Days Sales in Receivables Totes the efficiency in collecting receivables and in the management of credit (measures liquidity) Inventory Turnover Current Assets - Current Liabilities Current Assets Current Liabilities Quick Assets Current abilities Net Sales Average Accounts Receivable Average Accounts Receivable Average Daily Sales Cost of Goods Sold Average Inventory Average Inventory Average Daily Cost of Goods Sold Foxed Assets Long Term Liabilities Total Liabilities Total Stockholders Equity Income Before Income Tax Interest Expense Interest Expense To assess the efficiency in the management of inventory measures liquidity Number of Days Sales in Inventory Ratio of Fixed Assets to Long-Term Liabilities Ratio of Labilities to Stockholders Equity Number of Times Interest Charges Are Eamed To indicate the margin of safety to long-term creditors (measures solvency To indicate the margin of safety to creditors (measures solvency To assess the risk to debtholders in terms of number of times interest charges were earned measures solvency To assess the risk to preferred stockholders in terms of the number of mes preferred dividends were canned measures solvency To assess the effectiveness in the use of assets Number of Times Preferred Dividends Are Eamed Net Income Preferred Dividends Profitability Ratio of Net Sales to Assets Rate Earned on Total Assets To assess the profitability of the assets Rate Earned on Stockholders Equity To assess the profitability of the investment by stockholders Rate Earned on common Stockholders Equity Earnings per Share (EPS) on Common Stock Net Sales Average Total Assets (excluding long term investments Net Income Interest Expense Average Total Assets Net Income Average Total Stockholders Equity Net Income Preferred Dividends Average Common Stockholders Equity Net Income - Preferred Dividends Shares of Common Stock Outstanding Market Price per Share of Common Stock Earings per Share on Common Stock Dividends on Common Stock Shares of Common Stock Outstanding Dividends per Share of Common Stock Market Price per Share of Common Stock To assess the profitability of the investment by common stockholders Price Eamings (P/E Ratio To indicate future carings prospects based on the relationship between market value of common stock and earnings To indicate the extent to which earnings are being distributed to common stockhold To indicate the rate of return to common stockholdes in terms of dividends Dividends per Share Dividend Yield
Step by Step Solution
There are 3 Steps involved in it

Get step-by-step solutions from verified subject matter experts