

Question: Hello, Can someone please help me with these multiple choice economics questions? Question 19 The diagram illustrates isoprofit curves and the marginal cost curve of
Hello,
Can someone please help me with these multiple choice economics questions?
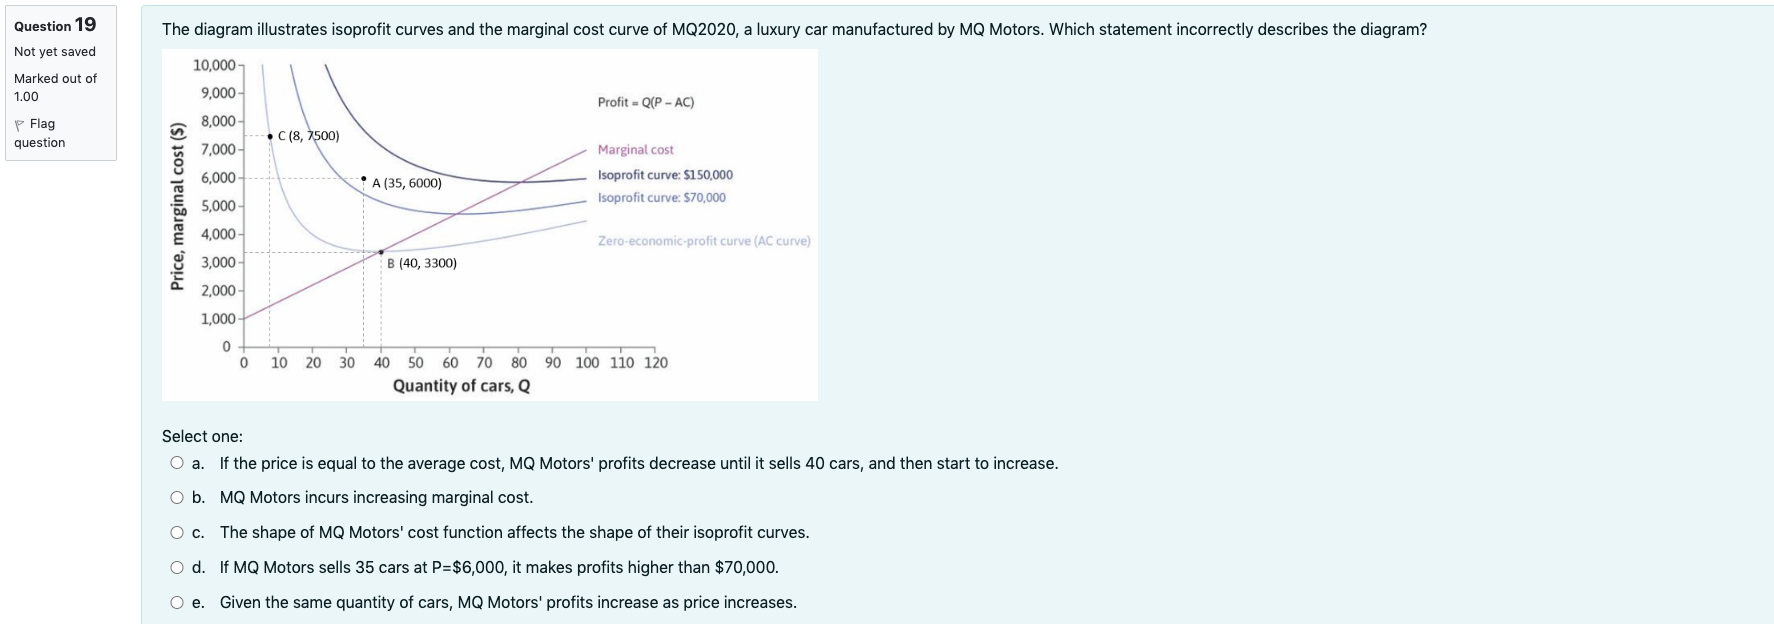
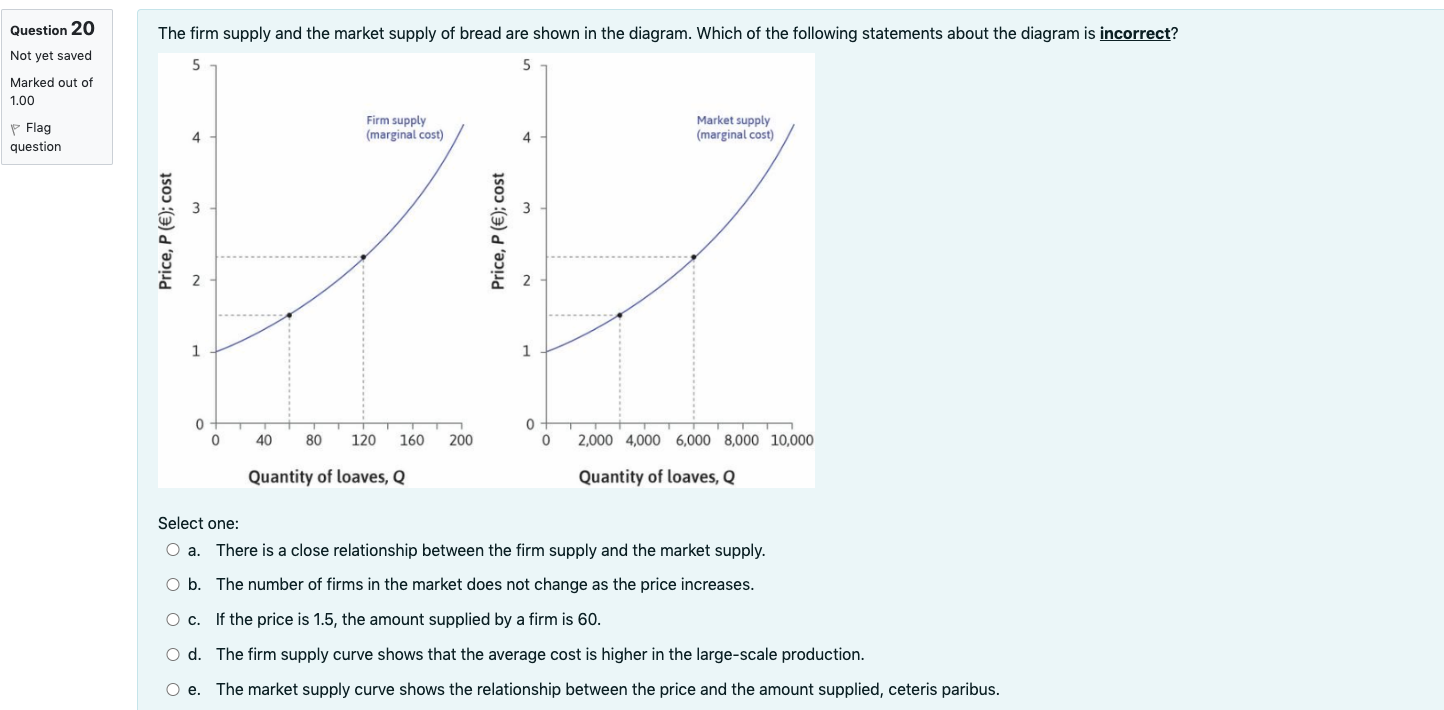
Question 19 The diagram illustrates isoprofit curves and the marginal cost curve of MQ2020, a luxury car manufactured by MQ Motors. Which statement incorrectly describes the diagram? Not yet saved 10,000- Marked out of 1.00 9,000- Profit = Q(P - AC) P Flag 8,000 question . C (8, 7500) 7,000- Marginal cost 6,000 " A (35, 6000) Isoprofit curve: $150,000 5,000 Isoprofit curve: $70,000 Price, marginal cost ($) 4,000- Zero-economic-profit curve (AC curve) 3,000 B (40, 3300) 2,000 1,000 0 10 20 30 40 50 60 70 80 90 100 110 120 Quantity of cars, Q Select one: O a. If the price is equal to the average cost, MQ Motors' profits decrease until it sells 40 cars, and then start to increase. O b. MQ Motors incurs increasing marginal cost. O c. The shape of MQ Motors' cost function affects the shape of their isoprofit curves. O d. If MQ Motors sells 35 cars at P=$6,000, it makes profits higher than $70,000. O e. Given the same quantity of cars, MQ Motors' profits increase as price increases.Question 20 The firm supply and the market supply of bread are shown in the diagram. Which of the following statements about the diagram is incorrect? Not yet saved 5 Marked out of 1.00 Flag Firm supply Market supply 4 (marginal cost) 4 (marginal cost) question 3 3 Price, P (E); cost Price, P (E); cost 2 2 1 1 0- 40 80 120 160 200 0 2,000 4,000 6,000 8,000 10,000 Quantity of loaves, Q Quantity of loaves, Q Select one: O a. There is a close relationship between the firm supply and the market supply. O b. The number of firms in the market does not change as the price increases. O c. If the price is 1.5, the amount supplied by a firm is 60. O d. The firm supply curve shows that the average cost is higher in the large-scale production. O e. The market supply curve shows the relationship between the price and the amount supplied, ceteris paribus
Step by Step Solution
There are 3 Steps involved in it

Get step-by-step solutions from verified subject matter experts