

Question: hello, can u answer it as soon as possible, this what all information i have, i ll give you big and fat thumbs up! this
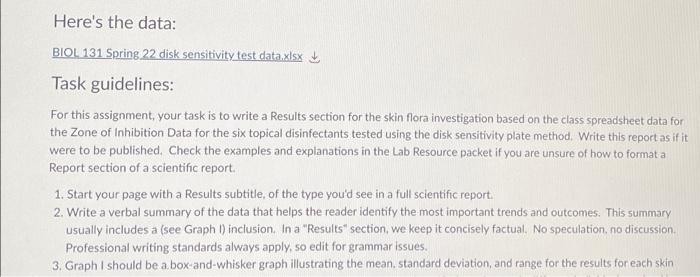
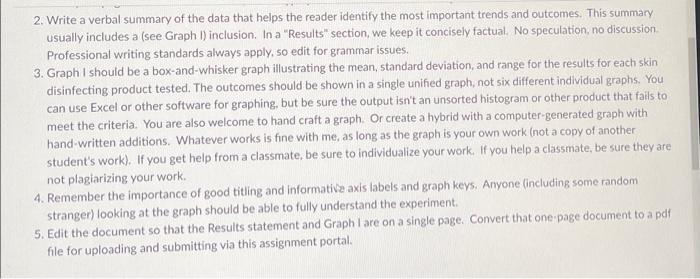
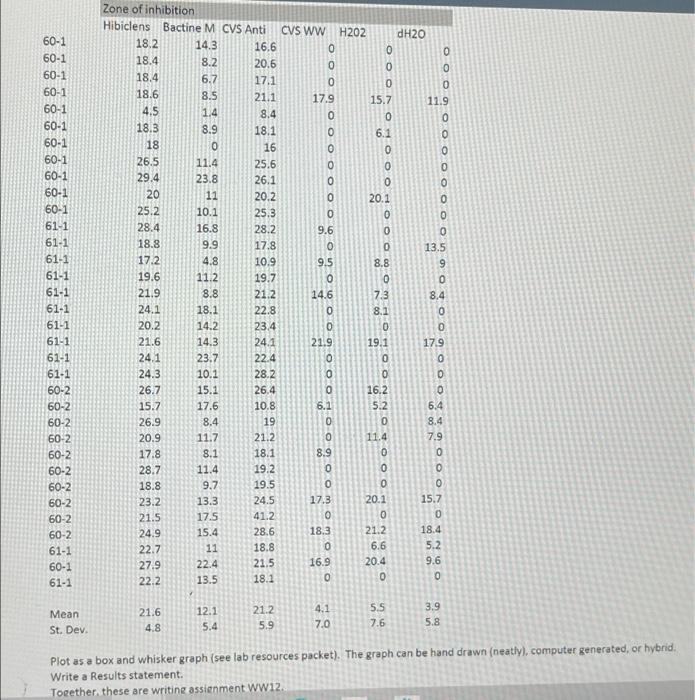
Here's the data: BIOL 131 Spring 22 disk sensitivity test data.xlsx Task guidelines: For this assignment, your task is to write a Results section for the skin flora investigation based on the class spreadsheet data for the Zone of Inhibition Data for the six topical disinfectants tested using the disk sensitivity plate method. Write this report as if it were to be published. Check the examples and explanations in the Lab Resource packet if you are unsure of how to format a Report section of a scientific report. 1. Start your page with a Results subtitle of the type you'd see in a full scientific report 2. Write a verbal summary of the data that helps the reader identify the most important trends and outcomes. This summary usually includes a (see Graph 1) inclusion. In a "Results" section, we keep it concisely factual. No speculation, no discussion Professional writing standards always apply, so edit for grammar issues. 3. Graph I should be a box-and-whisker graph illustrating the mean, standard deviation, and range for the results for each skin 2. Write a verbal summary of the data that helps the reader identify the most important trends and outcomes. This summary usually includes a (see Graph 1) inclusion. In a "Results" section, we keep it concisely factual. No speculation, no discussion Professional writing standards always apply, so edit for grammar issues. 3. Graph I should be a box-and-whisker graph illustrating the mean, standard deviation, and range for the results for each skin disinfecting product tested. The outcomes should be shown in a single unified graph, not six different individual graphs. You can use Excel or other software for graphing, but be sure the output isn't an unsorted histogram or other product that fails to meet the criteria. You are also welcome to hand craft a graph. Or create a hybrid with a computer-generated graph with hand written additions. Whatever works is fine with me, as long as the graph is your own work (not a copy of another student's work). If you get help from a classmate, be sure to individualize your work. If you help a classmate, be sure they are not plagiarizing your work. 4. Remember the importance of good titling and informative axis labels and graph keys. Anyone (including some random stranger) looking at the graph should be able to fully understand the experiment 5. Edit the document so that the Results statement and Graph I are on a single page. Convert that one page document to a pdf file for uploading and submitting via this assignment portal. 000 MNO OOO 0 O 60-1 60-1 60-1 60-1 60-1 60-1 60-1 60-1 60-1 60-1 60-1 61-1 61-1 61-1 61-1 61-1 61-1 61-1 61-1 61-1 61-1 60-2 60-2 60-2 60-2 60-2 60-2 60-2 60-2 60-2 60-2 61-1 60-1 61-1 Zone of inhibition Hibiclens Bactine M CVS Anti CVS WW H202 dH2O 18.2 14.3 16.6 18.4 8.2 20.6 0 18.4 6.7 17,1 18.6 8.5 21.1 17.9 15.7 11.9 4.5 1.4 8.4 0 18.3 8.9 18.1 6.1 18 0 16 26.5 11.4 25.6 0 29.4 23.8 26.1 20 11 20.2 20.1 25.2 10.1 25.3 28.4 16.8 28.2 9.6 18.8 9.9 17.8 13.5 17.2 4.8 10.9 9.5 8.8 19.6 112 19.7 21.9 8.8 21.2 14.6 7.3 24.1 18.1 22.8 8.1 20.2 14.2 23.4 21.6 14.3 24.1 21.9 19.1 17.9 24.1 23.7 22.4 24.3 10.1 28.2 26.7 15.1 26,4 15.7 17.6 10.8 6.2 5.2 6.4 26.9 8.4 19 20.9 11.7 21.2 11.4 7.9 17.8 8.1 18.1 8.9 28.7 11.4 19.2 18.8 9.7 19.5 23.2 13.3 24.5 17.3 20.1 15.7 21.5 17.5 24.9 15.4 28.6 18.3 21.2 18.4 22.7 11 18.8 6.6 5.2 27.9 22.4 21.5 16.9 20.4 9.6 22.2 18.1 OOOOOOOOOOOOOOOO 16.2 5. 41.2 ONTO U DO 13.5 4.1 Mean St. Dev. 21.6 4.8 12.1 5.4 21.2 5.9 5.5 7.6 bolo 3.9 5.8 7.0 9 Plot as a box and whisker graph (see lab resources packet). The graph can be hand drawn (neatly), computer generated, or hybrid. Write a Results statement. Together these are writing assignment WW12 Here's the data: BIOL 131 Spring 22 disk sensitivity test data.xlsx Task guidelines: For this assignment, your task is to write a Results section for the skin flora investigation based on the class spreadsheet data for the Zone of Inhibition Data for the six topical disinfectants tested using the disk sensitivity plate method. Write this report as if it were to be published. Check the examples and explanations in the Lab Resource packet if you are unsure of how to format a Report section of a scientific report. 1. Start your page with a Results subtitle of the type you'd see in a full scientific report 2. Write a verbal summary of the data that helps the reader identify the most important trends and outcomes. This summary usually includes a (see Graph 1) inclusion. In a "Results" section, we keep it concisely factual. No speculation, no discussion Professional writing standards always apply, so edit for grammar issues. 3. Graph I should be a box-and-whisker graph illustrating the mean, standard deviation, and range for the results for each skin 2. Write a verbal summary of the data that helps the reader identify the most important trends and outcomes. This summary usually includes a (see Graph 1) inclusion. In a "Results" section, we keep it concisely factual. No speculation, no discussion Professional writing standards always apply, so edit for grammar issues. 3. Graph I should be a box-and-whisker graph illustrating the mean, standard deviation, and range for the results for each skin disinfecting product tested. The outcomes should be shown in a single unified graph, not six different individual graphs. You can use Excel or other software for graphing, but be sure the output isn't an unsorted histogram or other product that fails to meet the criteria. You are also welcome to hand craft a graph. Or create a hybrid with a computer-generated graph with hand written additions. Whatever works is fine with me, as long as the graph is your own work (not a copy of another student's work). If you get help from a classmate, be sure to individualize your work. If you help a classmate, be sure they are not plagiarizing your work. 4. Remember the importance of good titling and informative axis labels and graph keys. Anyone (including some random stranger) looking at the graph should be able to fully understand the experiment 5. Edit the document so that the Results statement and Graph I are on a single page. Convert that one page document to a pdf file for uploading and submitting via this assignment portal. 000 MNO OOO 0 O 60-1 60-1 60-1 60-1 60-1 60-1 60-1 60-1 60-1 60-1 60-1 61-1 61-1 61-1 61-1 61-1 61-1 61-1 61-1 61-1 61-1 60-2 60-2 60-2 60-2 60-2 60-2 60-2 60-2 60-2 60-2 61-1 60-1 61-1 Zone of inhibition Hibiclens Bactine M CVS Anti CVS WW H202 dH2O 18.2 14.3 16.6 18.4 8.2 20.6 0 18.4 6.7 17,1 18.6 8.5 21.1 17.9 15.7 11.9 4.5 1.4 8.4 0 18.3 8.9 18.1 6.1 18 0 16 26.5 11.4 25.6 0 29.4 23.8 26.1 20 11 20.2 20.1 25.2 10.1 25.3 28.4 16.8 28.2 9.6 18.8 9.9 17.8 13.5 17.2 4.8 10.9 9.5 8.8 19.6 112 19.7 21.9 8.8 21.2 14.6 7.3 24.1 18.1 22.8 8.1 20.2 14.2 23.4 21.6 14.3 24.1 21.9 19.1 17.9 24.1 23.7 22.4 24.3 10.1 28.2 26.7 15.1 26,4 15.7 17.6 10.8 6.2 5.2 6.4 26.9 8.4 19 20.9 11.7 21.2 11.4 7.9 17.8 8.1 18.1 8.9 28.7 11.4 19.2 18.8 9.7 19.5 23.2 13.3 24.5 17.3 20.1 15.7 21.5 17.5 24.9 15.4 28.6 18.3 21.2 18.4 22.7 11 18.8 6.6 5.2 27.9 22.4 21.5 16.9 20.4 9.6 22.2 18.1 OOOOOOOOOOOOOOOO 16.2 5. 41.2 ONTO U DO 13.5 4.1 Mean St. Dev. 21.6 4.8 12.1 5.4 21.2 5.9 5.5 7.6 bolo 3.9 5.8 7.0 9 Plot as a box and whisker graph (see lab resources packet). The graph can be hand drawn (neatly), computer generated, or hybrid. Write a Results statement. Together these are writing assignment WW12
Step by Step Solution
There are 3 Steps involved in it

Get step-by-step solutions from verified subject matter experts