

Question: Hello, can you help answer the following question with the results attached ? 7:31 OFSU 3 AYAM tazki174 Active 19 hours ago t Stat: -3.89
Hello, can you help answer the following question with the results attached ?
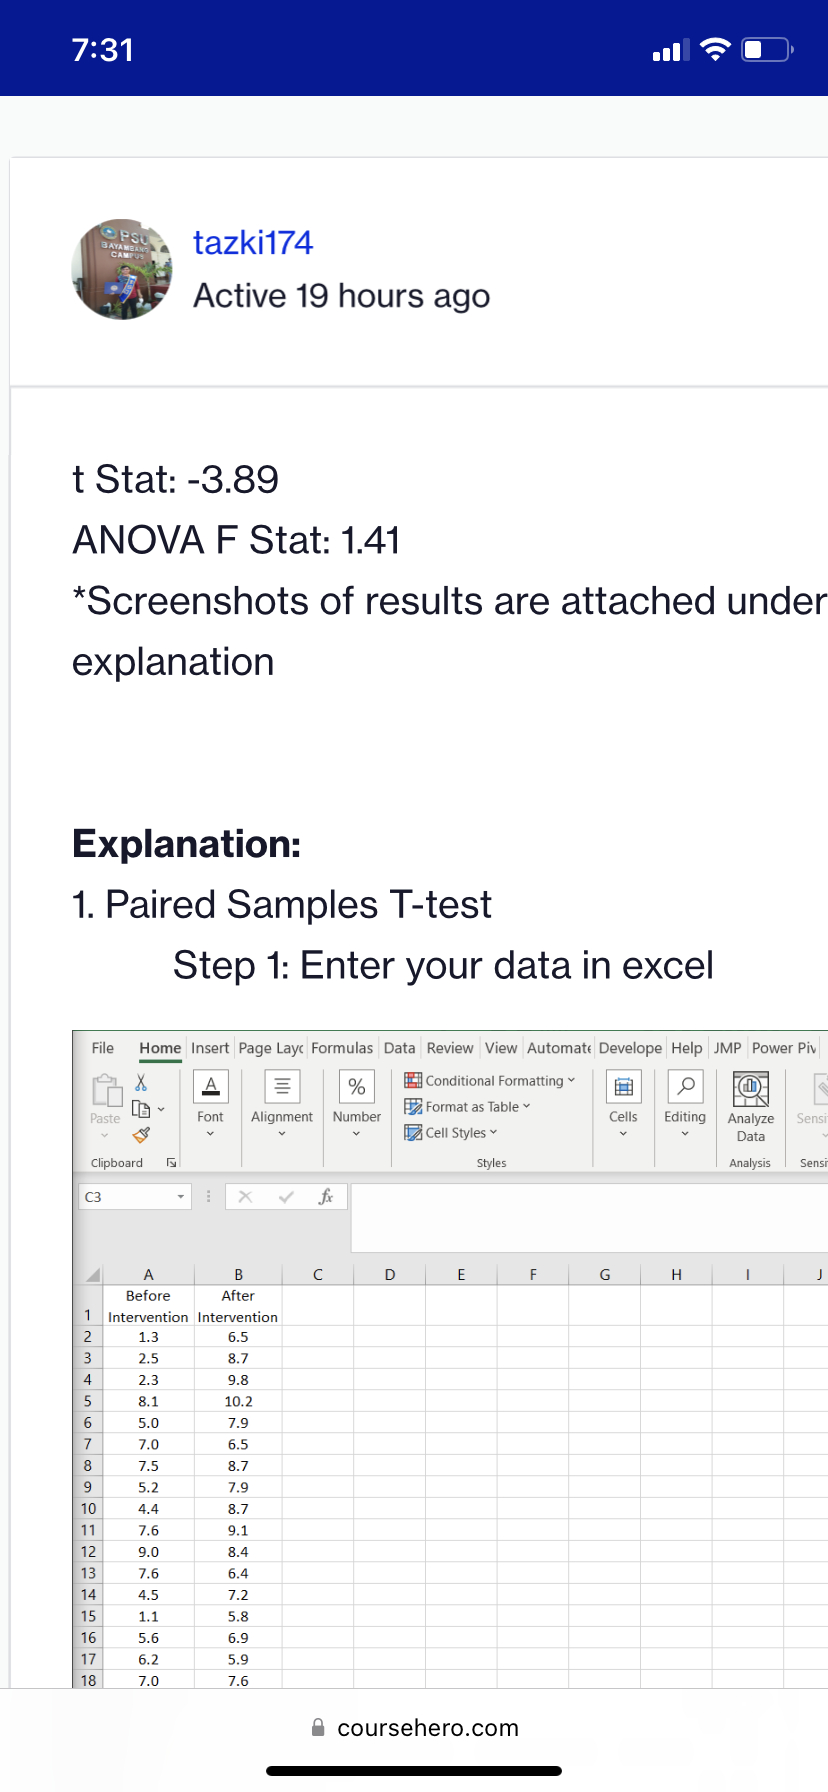
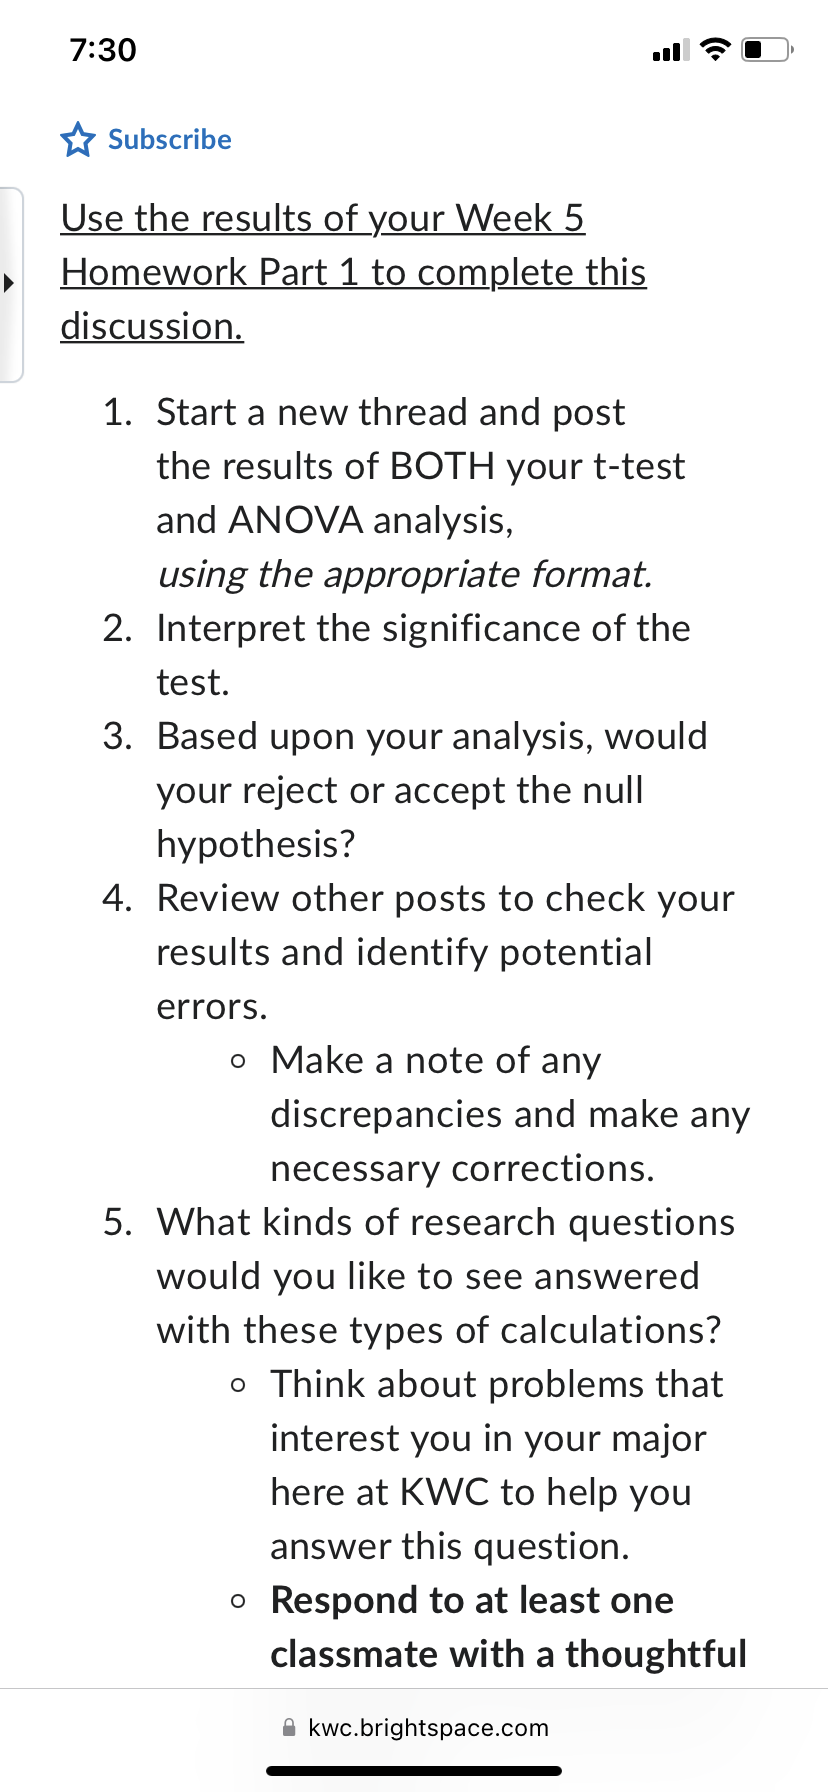
7:31 OFSU 3 AYAM tazki174 Active 19 hours ago t Stat: -3.89 ANOVA F Stat: 1.41 *Screenshots of results are attached under explanation Explanation: 1. Paired Samples T-test Step 1: Enter your data in excel File Home Insert Page Layc Formulas Data Review View Automate Develope Help JMP Power Piv A % Conditional Formatting O Format as Table Paste Font Alignment Number Cells Editing Analyze Sen Cell Styles Data Clipboard Styles Analysis Sensi C3 X V fix A B C D E F G H Before After Intervention Intervention 1.3 6.5 2.5 8.7 2.3 9.8 V O UA W N - 8.1 10.2 5.0 7.9 7.0 6.5 8 7.5 8.7 5.2 7.9 10 4.4 8.7 7.6 9.1 9.0 8.4 13 7.6 6.4 14 4.5 7.2 15 1.1 5.8 16 5.6 6.9 17 6.2 5.9 18 7.0 7.6 coursehero.com7230 a! '6" I ' 1? Subscribe Use the results of your Week 5 > Wiete this discussion. 1. Start a new thread and post the results of BOTH your t-test and ANOVA analysis, using the appropriate format. 2. Interpret the significance of the test. 3. Based upon your analysis, would your reject or accept the null hypothesis? 4. Review other posts to check your results and identify potential errors. 0 Make a note of any discrepancies and make any necessary corrections. 5. What kinds of research questions would you like to see answered with these types of calculations? 0 Think about problems that interest you in your major here at KWC to help you answer this question. 0 Respond to at least one classmate with a thoughtful E kwc.brightspace.com
Step by Step Solution
There are 3 Steps involved in it

Get step-by-step solutions from verified subject matter experts