

Question: Hello, Can you help me solve these questions? I need you to do all the questions if possible. Question 1 The UCL for an R-chart
Hello, Can you help me solve these questions? I need you to do all the questions if possible.
Question 1
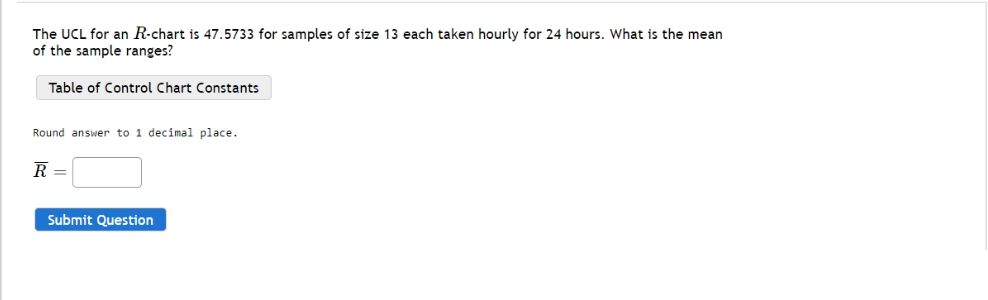
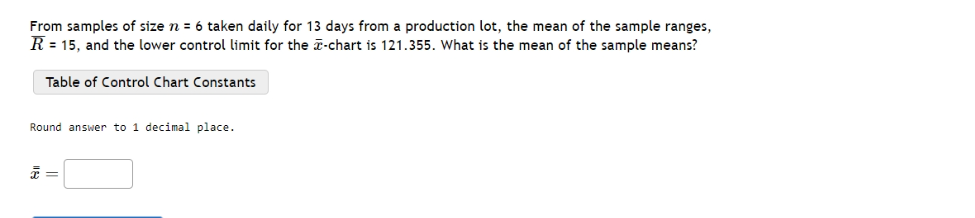
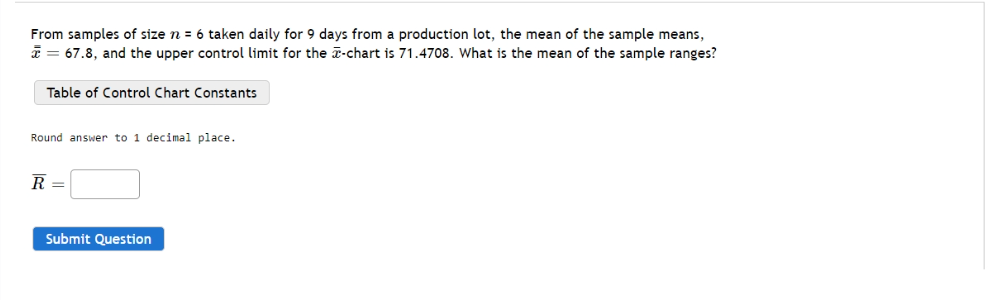
The UCL for an R-chart is 41533 for samples of size 13 each taken himrl)l for 24 hours. What is the mean of the sample ranges? Table of Control Chart Constant: Round answer to 1 decimal place. Submit Question From samples of size n. = a taken daily for 13 days from a production lot, the mean of the sample ranges, R = 15, and the lower control limit for the E-chart is 121.355. What 15 the mean of the sample means? Table ef Control Chart Constants Round answer to 1. decimal place. From samples of size n = 5 taken daily for 9 days from a production lot, the mean of the sample means, a". = 618, and the upper control limit for the i-chart is 71.4?08. What is the mean of the sample ranges? Table of Control Chart Constants Round answer to 1 decimal places Submit
Step by Step Solution
There are 3 Steps involved in it

Get step-by-step solutions from verified subject matter experts