

Question: Hello can you help me with the two problems shown below? Which graph shows the overall shape of the data? 0 bar chart 0 histogram
Hello can you help me with the two problems shown below?
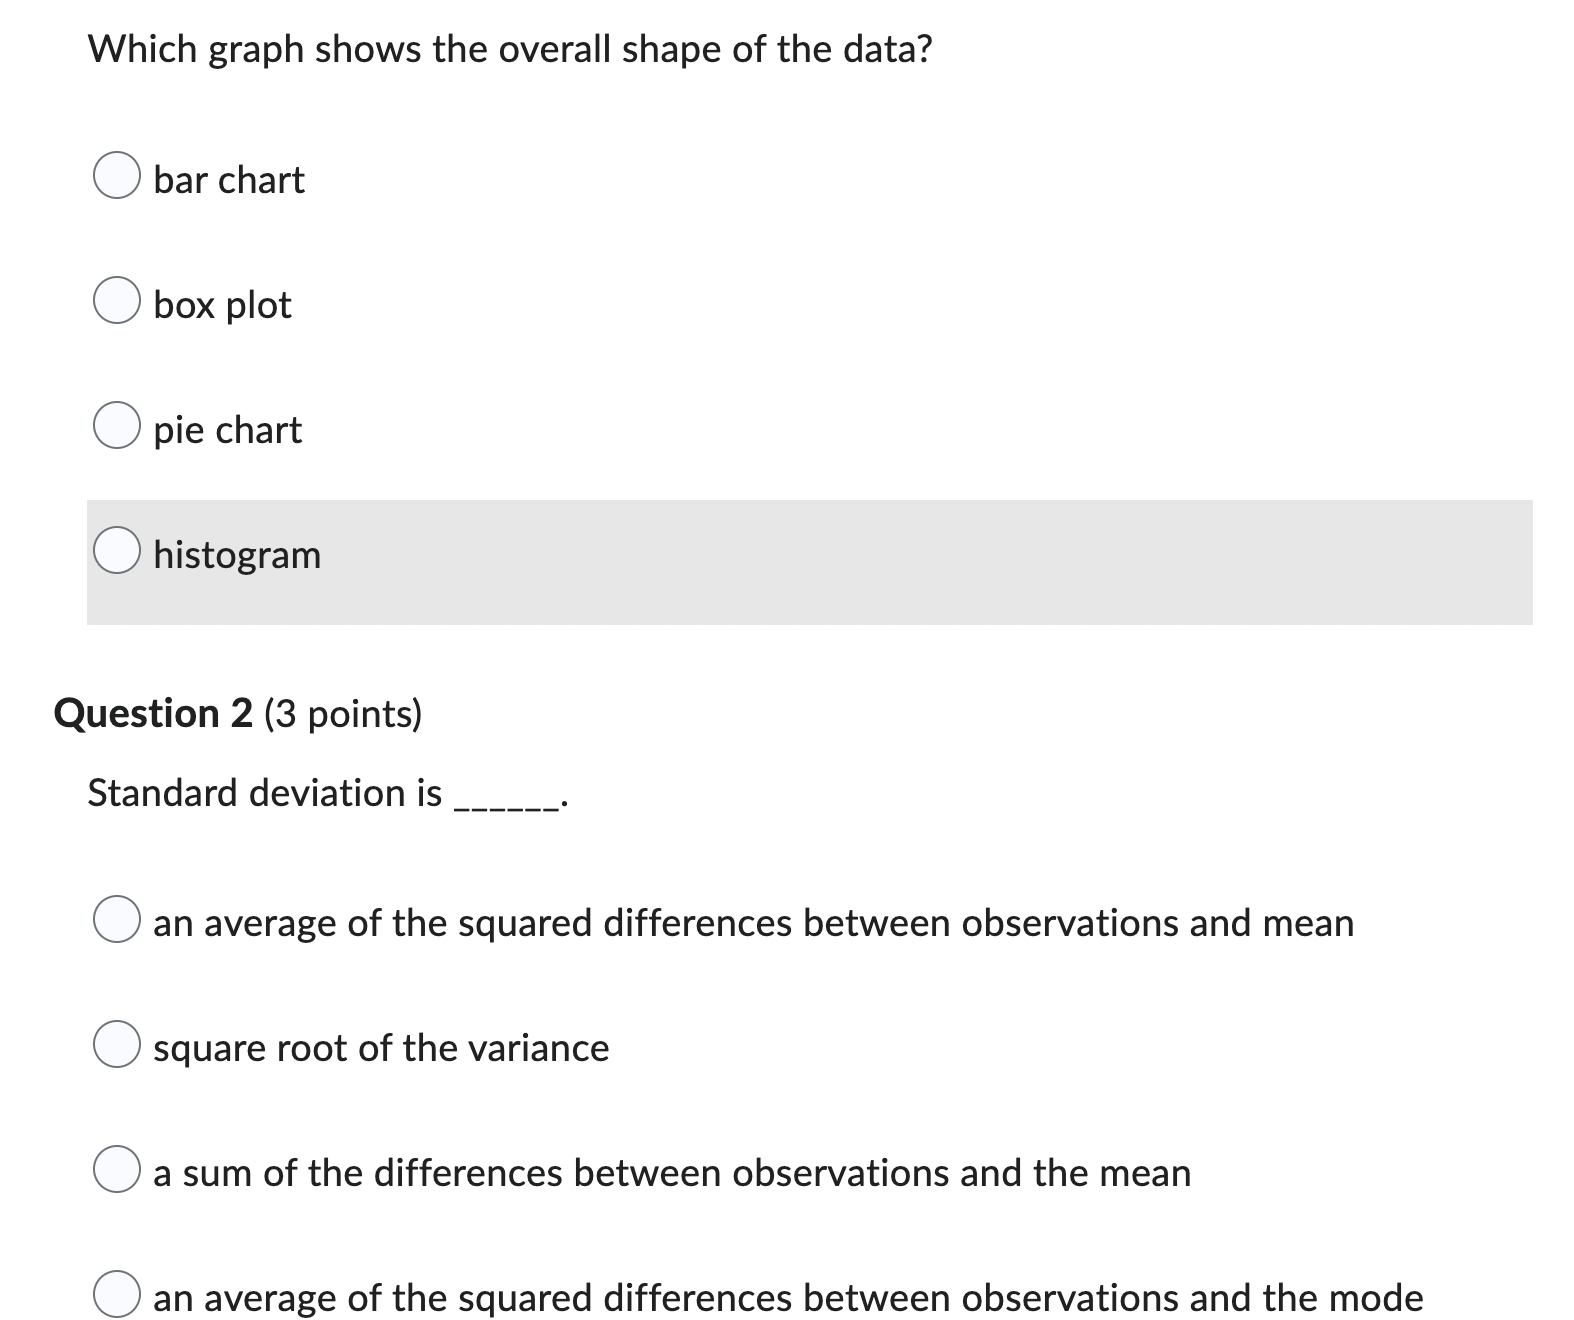
Which graph shows the overall shape of the data? 0 bar chart 0 histogram Question 2 (3 points) Standard deviation is O an average of the squared differences between observations and mean 0 square root of the variance 0 a sum of the differences between observations and the mean O an average of the squared differences between observations and the mode
Step by Step Solution
There are 3 Steps involved in it
1 Expert Approved Answer
Step: 1 Unlock

Question Has Been Solved by an Expert!
Get step-by-step solutions from verified subject matter experts
Step: 2 Unlock
Step: 3 Unlock