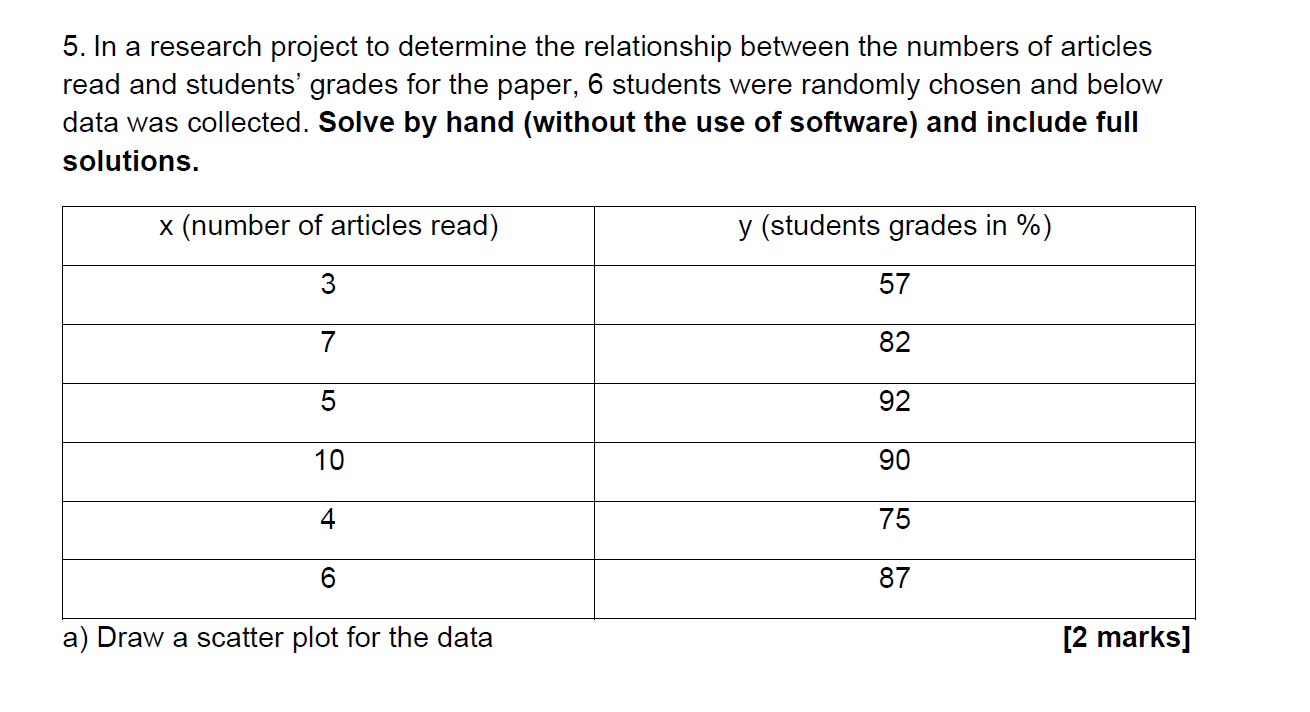
Question: Hello Can you help me with this exercise? 5. In a research project to determine the relationship between the numbers of articles read and students'

Hello Can you help me with this exercise?

Hello Can you help me with this exercise? 5. In aHello Can you help me with this exercise? 5. In aHello Can you help me with this exercise? 5. In a
5. In a research project to determine the relationship between the numbers of articles read and students' grades for the paper, 6 students were randomly chosen and below data was collected. Solve by hand (without the use of software) and include full solutions. x (number of articles read) y (students grades in %) 3 57 7 82 5 92 10 90 4 75 6 87 a) Draw a scatter plot for the data [2 marks]b) Find the equation of the line of best fit. Draw the line of best fit on the scatter plot diagram. Round off the coefficients to one decimal place. [6 marks] c) Find the coefficient of determination. Write a statement of interpretation for it. [3 marks]6. Solve question 5 again, using a statistical software (i.e., Excel, StatDisk, etc.). Copy and paste the software output to your assignment. [2 marks]

Step by Step Solution

There are 3 Steps involved in it

1 Expert Approved Answer
Step: 1 Unlock blur-text-image
Question Has Been Solved by an Expert!

Get step-by-step solutions from verified subject matter experts

Step: 2 Unlock
Step: 3 Unlock

Students Have Also Explored These Related Mathematics Questions!