

Question: Hello, can you please help me write a python program. This below is Lab 4. We can use this data to make a flood map
Hello, can you please help me write a python program.
This below is Lab 4.
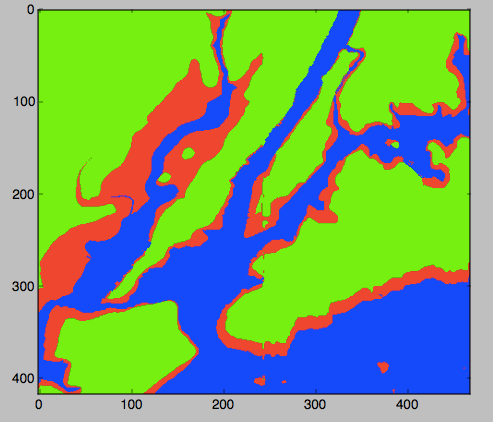
We can use this data to make a flood map of New York City. When Hurricane Sandy hit New York City in 2012, sea level rose 6 feet above normal, causing extensive flooding in low lying areas (NYT map). For our flood map, we can incorporate the storm surge into our coloring scheme:
if elevationTo give us complete control of the coloring, we will create a new array that will hold the colors for each pixel. Here's an outline of our program:
- Import the libraries to manipulate and display arrays.
- Read in the NYC data and store in the variable, elevations
- Create a new array, floodMap, to hold our colors for the map.
- For each element in elevations, make a pixel colored by the schema above.
- Load our image into pyplot.
- Display the image.
We'll use a very simple (but a bit garish) color scheme, with our "blue" being 0% red, 0% green, and 100% blue. And similarly, the "red" and the "green" we'll use will be 100% of each, 0% of the others, giving a map like:
Here's the code, implementing our outline below. Copy it into an IDLE window and run it. It expects that the file elevationsNYC.txt is in the same directory as your program.
# Name: ... your name here ... # Date: September 2017 # Takes elevation data of NYC and displays using the default color map #Import the libraries for arrays and displaying images: import numpy as np import matplotlib.pyplot as plt #Read in the data to an array, called elevations: elevations = np.loadtxt('elevationsNYC.txt') #Take the shape (dimensions) of the elevations # and add another dimension to hold the 3 color channels: mapShape = elevations.shape + (3,) #Create a blank image that's all zeros: floodMap = np.zeros(mapShape) for row in range(mapShape[0]): for col in range(mapShape[1]): if elevations[row,col]
This is what I need to do.
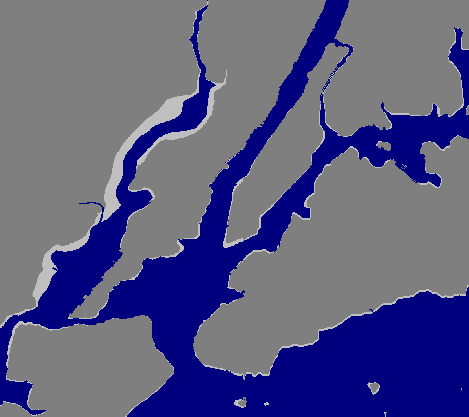
Modify the map-mapking program from Lab 4 to create a map that outlines the coastline. Your program should create a new image, called coast.png with the pixels colored as follows:
- If the elevation is less than or equal to 0, color the pixel 50% blue (and 0% red and 0% green).
- If the elevation is exactly 1, color the pixel 75% red, 75% green, and 75% blue.
- Otherwise, the pixel should be colored 50% red, 50% green, and 50% blue.
Your resulting map should look like:
100 300 400 100 200 300 400 100 300 400 100 200 300 400
Step by Step Solution
There are 3 Steps involved in it

Get step-by-step solutions from verified subject matter experts