

Question: hello, can you please write down step by step explanation for this question? 3. (5 points) The following cross-tabulation displays data for a sample of
hello, can you please write down step by step explanation for this question?
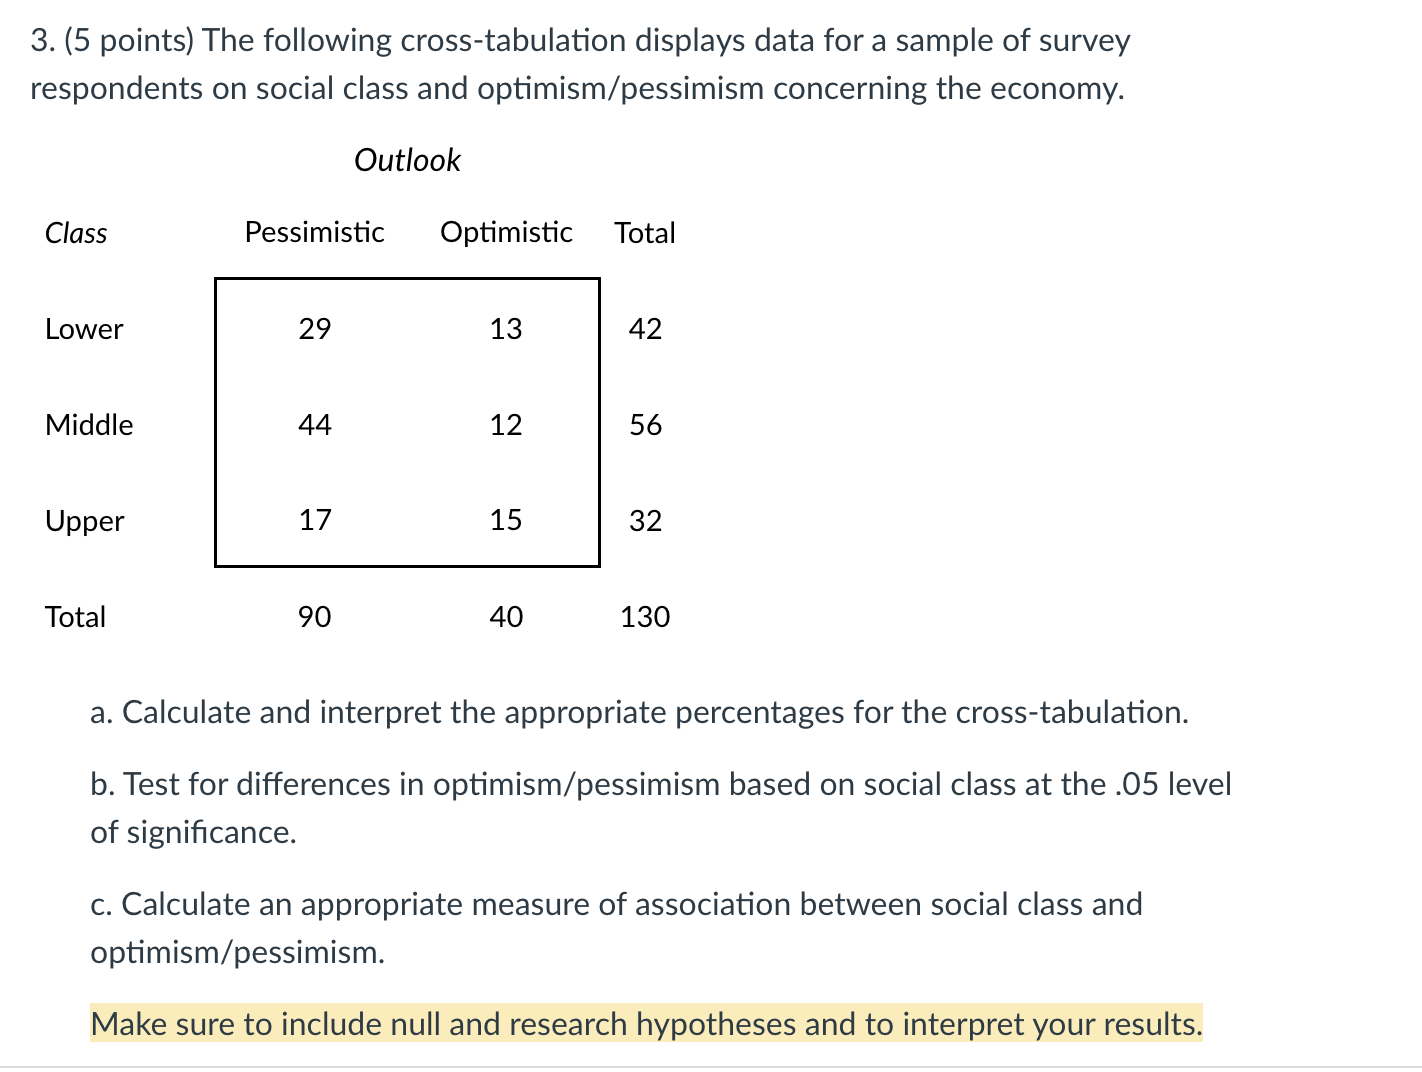
3. (5 points) The following cross-tabulation displays data for a sample of survey respondents on social class and optimism/pessimism concerning the economy. Outlook Class Pessimistic Optimistic Total Lower 29 13 42 Middle 44 12 56 Upper 17 15 32 Total 90 40 130 a. Calculate and interpret the appropriate percentages for the cross-tabulation. b. Test for differences in optimism/pessimism based on social class at the .05 level of signicance. c. Calculate an appropriate measure of association between social class and optimism/pessimism. Make sure to include null and research hypotheses and to interpret your results
Step by Step Solution
There are 3 Steps involved in it

Get step-by-step solutions from verified subject matter experts