

Question: hello can you provide step by step solution for each questions for part 1 to part 6 thank you ignore the first 2 images as
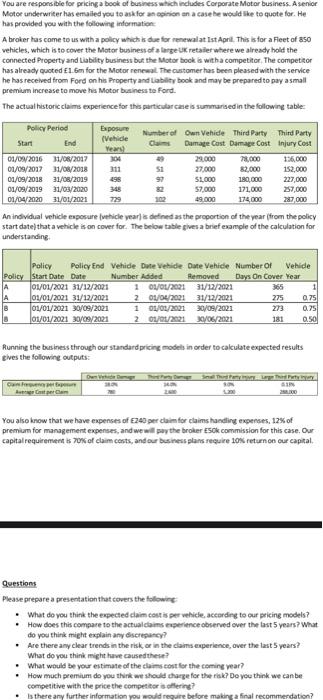
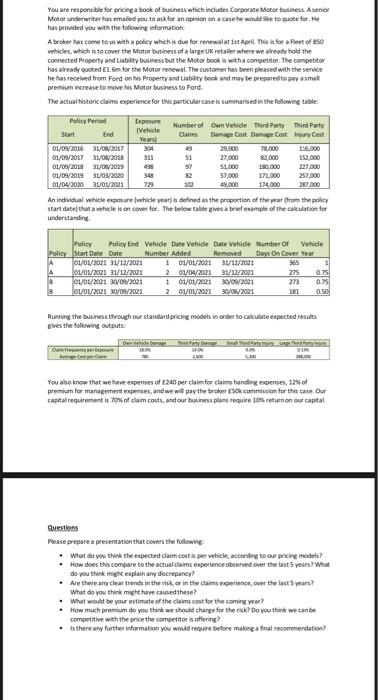
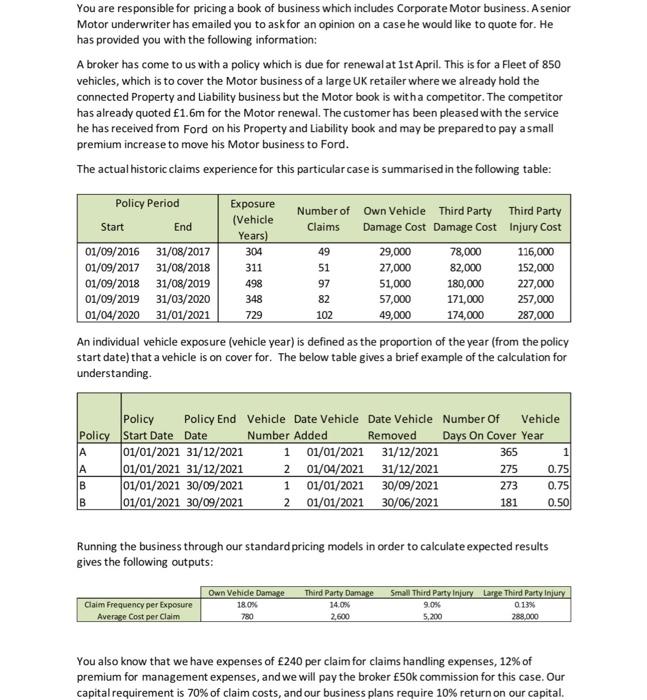
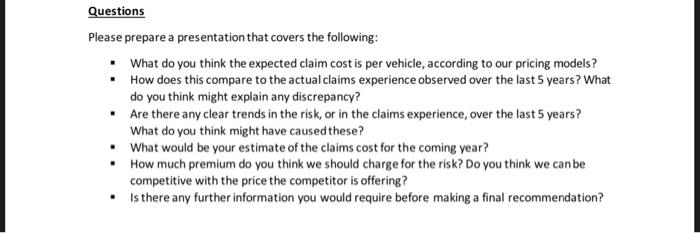
You are responsible for pricing a book of business which includes Corporate Motor business. A senior Motor underwriter has emailed you to ask for opinion on a case he would like to quote for. He has provided you with the following information A broker has come to us with a policy which is due for renewal at Ist April. This is for a Fleet of 350 vehicles, which is to cover the Motor business of large UK retailer where we already hold the connected Property and Liability business but the Motor books with competitor. The competitor has already quoted 1.6m for the Motor renewal. The customer has been pleased with the service he has received from Ford on his Property and liability book and may be prepared to pay a small premium increase to move his Motor businesste Ford. The actual historic claims experience for this particular cases summarised in the following table Policy Period Exposure Number of Own Vehide Third Party Third Party Start End (Vahide Year Cam Dumage Cost Damape Cost Injury Cost 01/09/2016 31/08/2017 29.000 78.000 136.000 01/09/2017 31/01/2018 3 S1 27.000 82.000 152,000 01/09/2018 31/05/2019 298 97 SL.000 180,000 227,000 01/09/2019 31/03/2020 348 57.000 171.000 287,000 01/04/2020 11/01/2021 729 102 19.000 174.000 287.000 An individual vehicle exposure vehicle year) is defined as the proportion of the year from the policy start date that a vehicle is on cover for. The below table gives a brief example of the calculation for understanding Policy Policy End Vehide Dute Vehide Date Vehicle Number of Vehide Policy Start Date Date Number Added Removed Days On Cover Year A 01/01/2001 31/12/2021 10/04/2021 31/12/2022 365 1 A 01/01/2001 31/12/2021 2 01/04/2021 31/12/2021 275 0.75 8 01/01/2021 30/09/2021 1 01/09/2001 30/09/2023 273 075 01/01/2021 20/09/2021 2 01/05/2001 19/06/2021 181 0.50 Running the business through our standard pricing models in order to calculate expected results Lives the following outputs: Garn You also know that we have expenses of E240 per claim for claims handling expenses, 12% of premium for management expenses, and we will pay the broker Esok commission for this case. Our capital requirements 70% of claim costs, and our business plans require 10% return on our capital Questions Please prepare a presentation that covers the following . What do you think the expected claim cstis per vehicle, according to our pricing models? How does this compare to the actualis experience observed over the last 5 years? What do you think might explain any discrepancy? . Are there any clear trends in the risk or in the claims experience, over the last 5 years? What do you think might have caused these? What would be your estimate of the claims cost for the coming year? How much premium do you think we should change for the risk? Do you think we can be competitive with the price the competitors offering? Is there any further information you would require before making a final recommendation? You are responsible for pricing a book of business which includes Corporate Motor business. A senior Motor underwriter has emailed you to ask for an opinion on a case he would like to quote for has provided you with the following information A broker has come to us with a policy which is due for renewalt In April. This is for a rest of 850 vehicles, which is to cover the Motor business of a large UK retailer where we already hold the connected Property and ability business but the Motor book with a competitor. The competitor has already usted Elm for the Motor tenewal. The customer has been pleased with the service he has received from Ford on his Property and liability book and may be prepared to pay a small premium increase to move is Motor business to Ford. The actual historic claims experience for this particular case is summarised in the following table Policy Period Deposure Number of Own Veide Third Party Third Party Start End Vehicle Years Caimo Damage Cost DamageCost Injury Cost 01/09/2016 31/08/2017 304 49 29,000 78,000 116,000 01/09/2017 31/01/2018 311 51 27,000 82.000 152.000 01/03/2018 31/08/2019 92 51,000 180.000 01/09/2019 31/01/2020 348 X2 57,000 01/04/2020 31/01/2021 729 114.000 229.000 An individual whicle exposure behicle is defined as the proportion of the war from the policy start date that a vehicle is on cover for the below table gives a brief emple of the calculation for understanding 171.000 Policy Policy End Vehicle Date Vehicle Date Vehicle Number of vehide Policy Start Date Date Number Added Removed Days On Cover Year 01/01/2021 31/12/2021 1 01/01/2001 31/12/2001 365 01/01/2021 31/12/2021 2 01/04/2021 31/12/2021 275 01/01/2002 2000/2001 1 01/01/2001 30/09/2001 273 07 01/01/2021 30/03/2001 2 01/01/2001 30/06/2003 361 0.50 IS Running the business through our standard pricing models in order to calculate expected results gives the following outputs De You also know that we are expenses of 240 per claim for claims handling expenses, 12% of premium for management expenses, and we will pay the broker Sok common for this case. Our capital requirement is 70% of calm costs, and our business plans require 10% return on our capital Questions Please prepare a presentation that covers the following What do you think the expected claim costa per vehicles.ceeding to our pricing models? How does this compare to the actual claims experience observed over the last years? What do you think might explain any discrepancy? Are there any clear trends in the risk or in the campince, over the last year? What do you think might have caused these? What would be your estimate of the most for the coming year? How much premium do you think we should charge for the risk Do you think we can be competitive with the price the competitors offering? Is there any further information you would require before making a final recommendation? You are responsible for pricing a book of business which includes Corporate Motor business. A senior Motor underwriter has emailed you to ask for an opinion on a case he would like to quote for. He has provided you with the following information: A broker has come to us with a policy which is due for renewal at 1st April. This is for a Fleet of 850 vehicles, which is to cover the Motor business of a large UK retailer where we already hold the connected Property and Liability business but the Motor book is with a competitor. The competitor has already quoted 1.6m for the Motor renewal. The customer has been pleased with the service he has received from Ford on his Property and Liability book and may be prepared to pay a small premium increase to move his Motor business to Ford. The actual historic claims experience for this particular case is summarised in the following table: Policy Period Exposure Number of Own Vehicle Third Party Third Party Start End (Vehicle Claims Years) Damage Cost Damage Cost Injury Cost 01/09/2016 31/08/2017 304 49 29,000 78,000 116,000 01/09/2017 31/08/2018 311 51 27,000 82,000 152,000 01/09/2018 31/08/2019 498 97 51,000 180,000 227,000 01/09/2019 31/03/2020 82 57,000 171,000 257,000 01/04/2020 31/01/2021 729 102 49,000 174,000 287,000 An individual vehicle exposure (vehicle year) is defined as the proportion of the year (from the policy start date) that a vehicle is on cover for. The below table gives a brief example of the calculation for understanding 348 365 1 Policy Policy End Vehicle Date Vehicle Date Vehicle Number of vehicle Policy Start Date Date Number Added Removed Days On Cover Year A 01/01/2021 31/12/2021 1 01/01/2021 31/12/2021 01/01/2021 31/12/2021 2 01/04/2021 31/12/2021 275 0.75 01/01/2021 30/09/2021 1 01/01/2021 30/09/2021 273 0.75 01/01/2021 30/09/2021 2 01/01/2021 30/06/2021 181 0.50 B B Running the business through our standard pricing models in order to calculate expected results gives the following outputs: Claim Frequency per Exposure Average Cost per Claim Own Vehide Damage 18.0% 780 Third Party Damage 14.08 2.600 Small Third Party Injury Larpe Third Party Injury 9.0% 0.13% 5,200 288.000 You also know that we have expenses of 240 per claim for claims handling expenses, 12% of premium for management expenses, and we will pay the broker 50k commission for this case. Our capital requirement is 70% of claim costs, and our business plans require 10% return on our capital. Questions Please prepare a presentation that covers the following: What do you think the expected claim cost is per vehicle, according to our pricing models? How does this compare to the actual claims experience observed over the last 5 years? What do you think might explain any discrepancy? . Are there any clear trends in the risk, or in the claims experience, over the last 5 years? What do you think might have caused these? What would be your estimate of the claims cost for the coming year? How much premium do you think we should charge for the risk? Do you think we can be competitive with the price the competitor is offering? Is there any further information you would require before making a final recommendation? You are responsible for pricing a book of business which includes Corporate Motor business. A senior Motor underwriter has emailed you to ask for opinion on a case he would like to quote for. He has provided you with the following information A broker has come to us with a policy which is due for renewal at Ist April. This is for a Fleet of 350 vehicles, which is to cover the Motor business of large UK retailer where we already hold the connected Property and Liability business but the Motor books with competitor. The competitor has already quoted 1.6m for the Motor renewal. The customer has been pleased with the service he has received from Ford on his Property and liability book and may be prepared to pay a small premium increase to move his Motor businesste Ford. The actual historic claims experience for this particular cases summarised in the following table Policy Period Exposure Number of Own Vehide Third Party Third Party Start End (Vahide Year Cam Dumage Cost Damape Cost Injury Cost 01/09/2016 31/08/2017 29.000 78.000 136.000 01/09/2017 31/01/2018 3 S1 27.000 82.000 152,000 01/09/2018 31/05/2019 298 97 SL.000 180,000 227,000 01/09/2019 31/03/2020 348 57.000 171.000 287,000 01/04/2020 11/01/2021 729 102 19.000 174.000 287.000 An individual vehicle exposure vehicle year) is defined as the proportion of the year from the policy start date that a vehicle is on cover for. The below table gives a brief example of the calculation for understanding Policy Policy End Vehide Dute Vehide Date Vehicle Number of Vehide Policy Start Date Date Number Added Removed Days On Cover Year A 01/01/2001 31/12/2021 10/04/2021 31/12/2022 365 1 A 01/01/2001 31/12/2021 2 01/04/2021 31/12/2021 275 0.75 8 01/01/2021 30/09/2021 1 01/09/2001 30/09/2023 273 075 01/01/2021 20/09/2021 2 01/05/2001 19/06/2021 181 0.50 Running the business through our standard pricing models in order to calculate expected results Lives the following outputs: Garn You also know that we have expenses of E240 per claim for claims handling expenses, 12% of premium for management expenses, and we will pay the broker Esok commission for this case. Our capital requirements 70% of claim costs, and our business plans require 10% return on our capital Questions Please prepare a presentation that covers the following . What do you think the expected claim cstis per vehicle, according to our pricing models? How does this compare to the actualis experience observed over the last 5 years? What do you think might explain any discrepancy? . Are there any clear trends in the risk or in the claims experience, over the last 5 years? What do you think might have caused these? What would be your estimate of the claims cost for the coming year? How much premium do you think we should change for the risk? Do you think we can be competitive with the price the competitors offering? Is there any further information you would require before making a final recommendation? You are responsible for pricing a book of business which includes Corporate Motor business. A senior Motor underwriter has emailed you to ask for an opinion on a case he would like to quote for has provided you with the following information A broker has come to us with a policy which is due for renewalt In April. This is for a rest of 850 vehicles, which is to cover the Motor business of a large UK retailer where we already hold the connected Property and ability business but the Motor book with a competitor. The competitor has already usted Elm for the Motor tenewal. The customer has been pleased with the service he has received from Ford on his Property and liability book and may be prepared to pay a small premium increase to move is Motor business to Ford. The actual historic claims experience for this particular case is summarised in the following table Policy Period Deposure Number of Own Veide Third Party Third Party Start End Vehicle Years Caimo Damage Cost DamageCost Injury Cost 01/09/2016 31/08/2017 304 49 29,000 78,000 116,000 01/09/2017 31/01/2018 311 51 27,000 82.000 152.000 01/03/2018 31/08/2019 92 51,000 180.000 01/09/2019 31/01/2020 348 X2 57,000 01/04/2020 31/01/2021 729 114.000 229.000 An individual whicle exposure behicle is defined as the proportion of the war from the policy start date that a vehicle is on cover for the below table gives a brief emple of the calculation for understanding 171.000 Policy Policy End Vehicle Date Vehicle Date Vehicle Number of vehide Policy Start Date Date Number Added Removed Days On Cover Year 01/01/2021 31/12/2021 1 01/01/2001 31/12/2001 365 01/01/2021 31/12/2021 2 01/04/2021 31/12/2021 275 01/01/2002 2000/2001 1 01/01/2001 30/09/2001 273 07 01/01/2021 30/03/2001 2 01/01/2001 30/06/2003 361 0.50 IS Running the business through our standard pricing models in order to calculate expected results gives the following outputs De You also know that we are expenses of 240 per claim for claims handling expenses, 12% of premium for management expenses, and we will pay the broker Sok common for this case. Our capital requirement is 70% of calm costs, and our business plans require 10% return on our capital Questions Please prepare a presentation that covers the following What do you think the expected claim costa per vehicles.ceeding to our pricing models? How does this compare to the actual claims experience observed over the last years? What do you think might explain any discrepancy? Are there any clear trends in the risk or in the campince, over the last year? What do you think might have caused these? What would be your estimate of the most for the coming year? How much premium do you think we should charge for the risk Do you think we can be competitive with the price the competitors offering? Is there any further information you would require before making a final recommendation? You are responsible for pricing a book of business which includes Corporate Motor business. A senior Motor underwriter has emailed you to ask for an opinion on a case he would like to quote for. He has provided you with the following information: A broker has come to us with a policy which is due for renewal at 1st April. This is for a Fleet of 850 vehicles, which is to cover the Motor business of a large UK retailer where we already hold the connected Property and Liability business but the Motor book is with a competitor. The competitor has already quoted 1.6m for the Motor renewal. The customer has been pleased with the service he has received from Ford on his Property and Liability book and may be prepared to pay a small premium increase to move his Motor business to Ford. The actual historic claims experience for this particular case is summarised in the following table: Policy Period Exposure Number of Own Vehicle Third Party Third Party Start End (Vehicle Claims Years) Damage Cost Damage Cost Injury Cost 01/09/2016 31/08/2017 304 49 29,000 78,000 116,000 01/09/2017 31/08/2018 311 51 27,000 82,000 152,000 01/09/2018 31/08/2019 498 97 51,000 180,000 227,000 01/09/2019 31/03/2020 82 57,000 171,000 257,000 01/04/2020 31/01/2021 729 102 49,000 174,000 287,000 An individual vehicle exposure (vehicle year) is defined as the proportion of the year (from the policy start date) that a vehicle is on cover for. The below table gives a brief example of the calculation for understanding 348 365 1 Policy Policy End Vehicle Date Vehicle Date Vehicle Number of vehicle Policy Start Date Date Number Added Removed Days On Cover Year A 01/01/2021 31/12/2021 1 01/01/2021 31/12/2021 01/01/2021 31/12/2021 2 01/04/2021 31/12/2021 275 0.75 01/01/2021 30/09/2021 1 01/01/2021 30/09/2021 273 0.75 01/01/2021 30/09/2021 2 01/01/2021 30/06/2021 181 0.50 B B Running the business through our standard pricing models in order to calculate expected results gives the following outputs: Claim Frequency per Exposure Average Cost per Claim Own Vehide Damage 18.0% 780 Third Party Damage 14.08 2.600 Small Third Party Injury Larpe Third Party Injury 9.0% 0.13% 5,200 288.000 You also know that we have expenses of 240 per claim for claims handling expenses, 12% of premium for management expenses, and we will pay the broker 50k commission for this case. Our capital requirement is 70% of claim costs, and our business plans require 10% return on our capital. Questions Please prepare a presentation that covers the following: What do you think the expected claim cost is per vehicle, according to our pricing models? How does this compare to the actual claims experience observed over the last 5 years? What do you think might explain any discrepancy? . Are there any clear trends in the risk, or in the claims experience, over the last 5 years? What do you think might have caused these? What would be your estimate of the claims cost for the coming year? How much premium do you think we should charge for the risk? Do you think we can be competitive with the price the competitor is offering? Is there any further information you would require before making a final recommendation
Step by Step Solution
There are 3 Steps involved in it

Get step-by-step solutions from verified subject matter experts