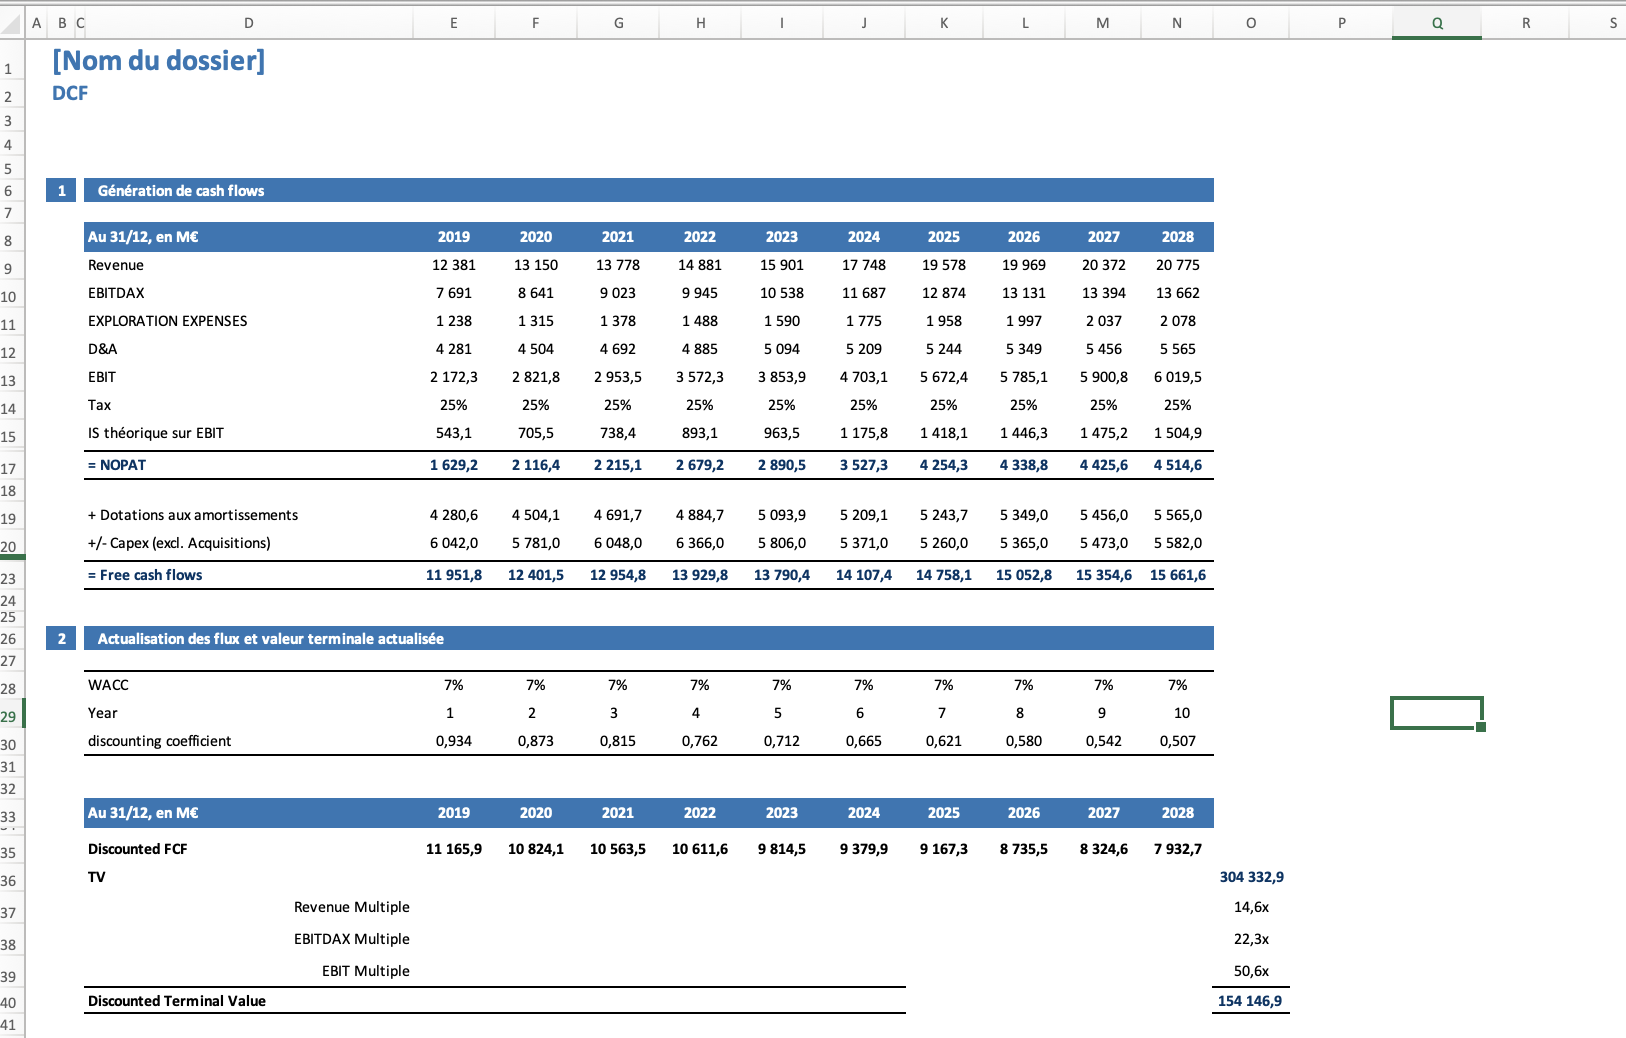
Question: Hello, could you help me with this question (WACC =7%). I should find around 40 billion, but i find way more and don't undertsand why
Hello, could you help me with this question (WACC =7%). I should find around 40 billion, but i find way more and don't undertsand why
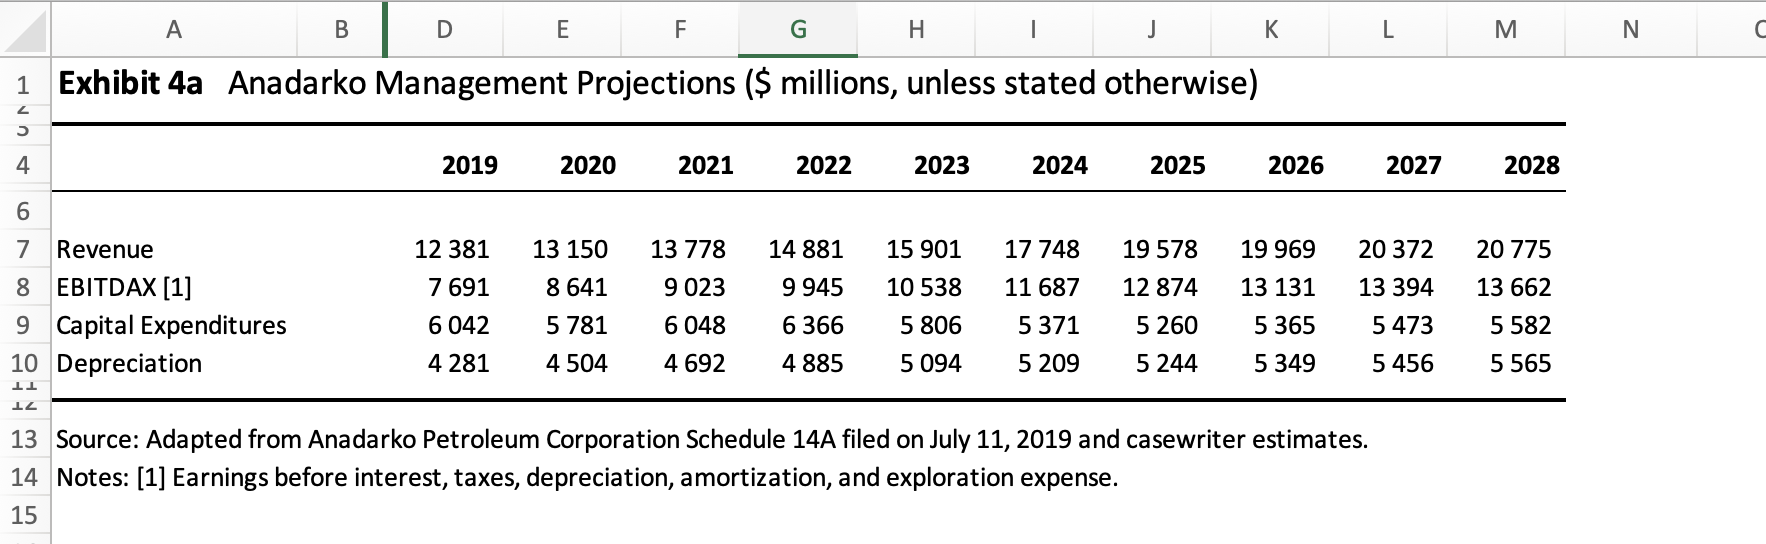
4. a. Please compute the standalone value of Anadarko using DCF. Make the following assumptions: (i) net working capital needs are negligible; (ii) exploration expense is 10% of revenues; (iii) the tax rate is 25%; the cost of debt of Anadarko is 4%. How does your DCF estimate compare with the value of $40 billion in Question 3? b. How much are the synergies worth? c. Please value the deal using transaction multiples
A B D E F G H K L M N Exhibit 4a Anadarko Management Projections ($ millions, unless stated otherwise) 4 2019 2020 2021 2022 2023 2024 2025 2026 2027 2028 6 7 Revenue 12 381 13 150 13 778 14 881 15 901 17 748 19 578 19 969 20 372 20 775 8 EBITDAX [1] 7 691 8 641 9 023 9 945 10 538 11 687 12 874 13 131 13 394 13 662 9 Capital Expenditures 6 042 5 781 6 048 6 366 5 806 5 371 5 260 5 365 5 473 5 582 10 Depreciation 4 281 4 504 4 692 4 885 5 094 5 209 5 244 5 349 5 456 TT 5 565 7T 13 Source: Adapted from Anadarko Petroleum Corporation Schedule 14A filed on July 11, 2019 and casewriter estimates. 14 Notes: [1] Earnings before interest, taxes, depreciation, amortization, and exploration expense. 15N D E F G H I K L M 0 P Q R ABC [ Nom du dossier] DCF 1 Generation de cash flows Au 31/12, en ME 2019 2020 2021 2022 2023 2024 2025 2026 2027 2028 12 381 13 150 13 778 14 881 15 901 17 748 19 578 19 969 20 372 20 775 Revenue 7 691 8 641 9 023 9 945 10 538 11 687 12 874 13 131 13 394 13 662 EBITDAX 1 238 1 315 1 378 1 488 1 590 1 775 1 997 2 037 2 078 EXPLORATION EXPENSES 1 958 4 281 4 504 4 692 4 885 5 094 5 209 5 244 5 349 5 456 5 565 D&A EBIT 2 172,3 2 821,8 2 953,5 3 572,3 3 853,9 4 703,1 5 672,4 5 785,1 5 900,8 6 019,5 25% 25% 25% 25% 25% 25% 25% 25% 25% Tax 25% 543,1 705,5 738,4 963,5 1 175,8 1 418,1 1 446,3 1 475,2 1 504,9 IS theorique sur EBIT 893,1 = NOPAT 1 629,2 2 116,4 2 215,1 2 679,2 2 890,5 3 527,3 4 254,3 4 338,8 4 425,6 4 514,6 4 280,6 4 504,1 4 691,7 4 884,7 5 093,9 5 209,1 5 243,7 5 349,0 5 456,0 5 565,0 + Dotations aux amortissements 6 042,0 5 781, 6 366,0 5 806, 5 371, 5 260,0 5 365,C 5 473,0 5 582,C +/- Capex (excl. Acquisitions) 6 048, Free cash flows 11 951,8 12 401,5 12 954,8 13 929,8 13 790,4 14 107,4 14 758,1 15 052,8 15 354,6 15 661,6 26 2 Actualisation des flux et valeur terminale actualisee 7% 7% 7% WACC 7% 7% 7% 7% 7% 28 7% 7% 10 Year 0,712 0.665 0,621 0,580 0,542 0.507 discounting coefficient 0,934 0,873 0.815 0,762 2027 2028 Au 31/12, en ME 2019 2020 2021 2022 2023 2024 2025 026 Discounted FCF 11 165,9 10 824,1 10 563,5 10 611,6 9 814,5 9 379,9 9 167,3 8 735,5 8 324,6 7 932,7 304 332,9 TV 14,6x Revenue Multiple 22,3x EBITDAX Multiple 50,6x EBIT Multiple 154 146,9 Discounted Terminal Value