

Question: Hello could you please help me with the question attached? To complete this proiect step address the following emand for Crudo 1. Based on the
Hello could you please help me with the question attached? 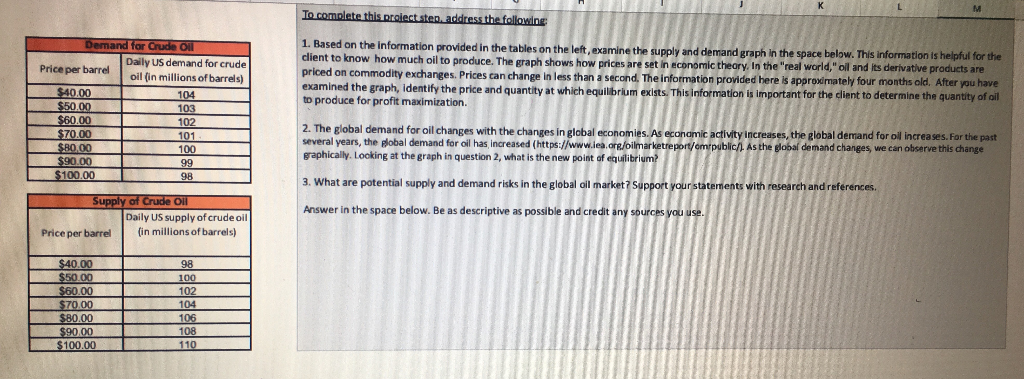
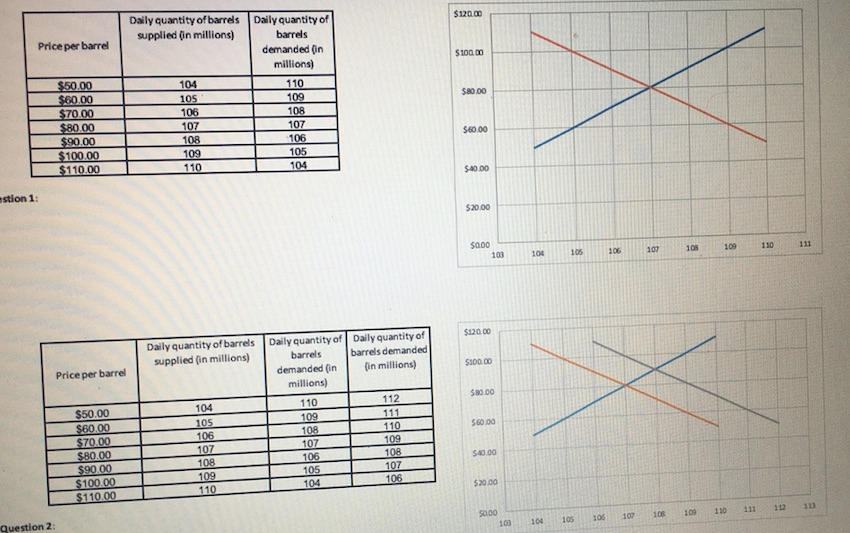
To complete this proiect step address the following emand for Crudo 1. Based on the information provided in the tables on the left, examine the supply and demand graph in the space below. This information is helpful for the client to know how much oil to produce. The graph shows how prices are set in Economic theory. In the "real world,"oll and its derivative products are priced on commodity exchanges. Prices can change in less than a second. The information provided here is approximately four months old. After you have examined the graph, identify the price and quantity at which equilibrium exists. This information is important for the client to determine the quantity of all to produce for profit maximization. Price per barrel $40.00 $50.00 $60.00 $70.00 $80.00 $90.00 $100.00 Daily US demand for crude oil in millions of barrels) 104 103 102 101 100 2. The global demand for oil changes with the changes in global economies. As economic activity increases, the global demand for oil increases. For the past several years, the pobal demand for oil has increased (https://www.iea.org/oilmarketreport/om public. As the global demand changes, we can observe this change graphically. Looking at the graph in question 2, what is the new point of equilibrium? 98 3. What are potential supply and demand risks in the global oil market Support your statements with research and references. Answer in the space below. Be as descriptive as possible and credit any sources you use. Supply of Crude Oil Daily US supply of crude oil Price per barrel fin millions of barrels) 98 100 102 $40.00 $50.00 $60.00 $70,00 $80.00 $90.00 $100.00 El Daily quantity of barrels supplied in millions) $120. Price per barrel S1000 Daily quantity of barrels demanded in millions) 110 109 108 107 106 105 105 $50.00 $60.00 $70.00 $80.00 $90.00 $100.00 $110.00 SRO DO 107 108 109 110 $60.00 104 stion 1: $40 DO $20.00 $0.00 Daily Quantity of barrels supplied (in millions) $120.00 Price per barrel Daily quantity of Daily quantity of barrels barrels demanded demanded (in in millions) millions) $100.00 104 112 SO DO 110 $60.00 $50.00 $60.00 $70.00 $80.00 $90.00 $100.00 $110.00 105 106 107 108 109 110 110 109 108 107 106 105 104 109 108 560.00 107 106 $20.00 estion 2 5000 103 104 105 106 108 109 110 111 112 111 To complete this proiect step address the following emand for Crudo 1. Based on the information provided in the tables on the left, examine the supply and demand graph in the space below. This information is helpful for the client to know how much oil to produce. The graph shows how prices are set in Economic theory. In the "real world,"oll and its derivative products are priced on commodity exchanges. Prices can change in less than a second. The information provided here is approximately four months old. After you have examined the graph, identify the price and quantity at which equilibrium exists. This information is important for the client to determine the quantity of all to produce for profit maximization. Price per barrel $40.00 $50.00 $60.00 $70.00 $80.00 $90.00 $100.00 Daily US demand for crude oil in millions of barrels) 104 103 102 101 100 2. The global demand for oil changes with the changes in global economies. As economic activity increases, the global demand for oil increases. For the past several years, the pobal demand for oil has increased (https://www.iea.org/oilmarketreport/om public. As the global demand changes, we can observe this change graphically. Looking at the graph in question 2, what is the new point of equilibrium? 98 3. What are potential supply and demand risks in the global oil market Support your statements with research and references. Answer in the space below. Be as descriptive as possible and credit any sources you use. Supply of Crude Oil Daily US supply of crude oil Price per barrel fin millions of barrels) 98 100 102 $40.00 $50.00 $60.00 $70,00 $80.00 $90.00 $100.00 El Daily quantity of barrels supplied in millions) $120. Price per barrel S1000 Daily quantity of barrels demanded in millions) 110 109 108 107 106 105 105 $50.00 $60.00 $70.00 $80.00 $90.00 $100.00 $110.00 SRO DO 107 108 109 110 $60.00 104 stion 1: $40 DO $20.00 $0.00 Daily Quantity of barrels supplied (in millions) $120.00 Price per barrel Daily quantity of Daily quantity of barrels barrels demanded demanded (in in millions) millions) $100.00 104 112 SO DO 110 $60.00 $50.00 $60.00 $70.00 $80.00 $90.00 $100.00 $110.00 105 106 107 108 109 110 110 109 108 107 106 105 104 109 108 560.00 107 106 $20.00 estion 2 5000 103 104 105 106 108 109 110 111 112 111
Step by Step Solution
There are 3 Steps involved in it

Get step-by-step solutions from verified subject matter experts