

Question: Hello, could you please help me with these problems, I am having a lot of problems to get the correct results. A newspaper published an


Hello, could you please help me with these problems, I am having a lot of problems to get the correct results.
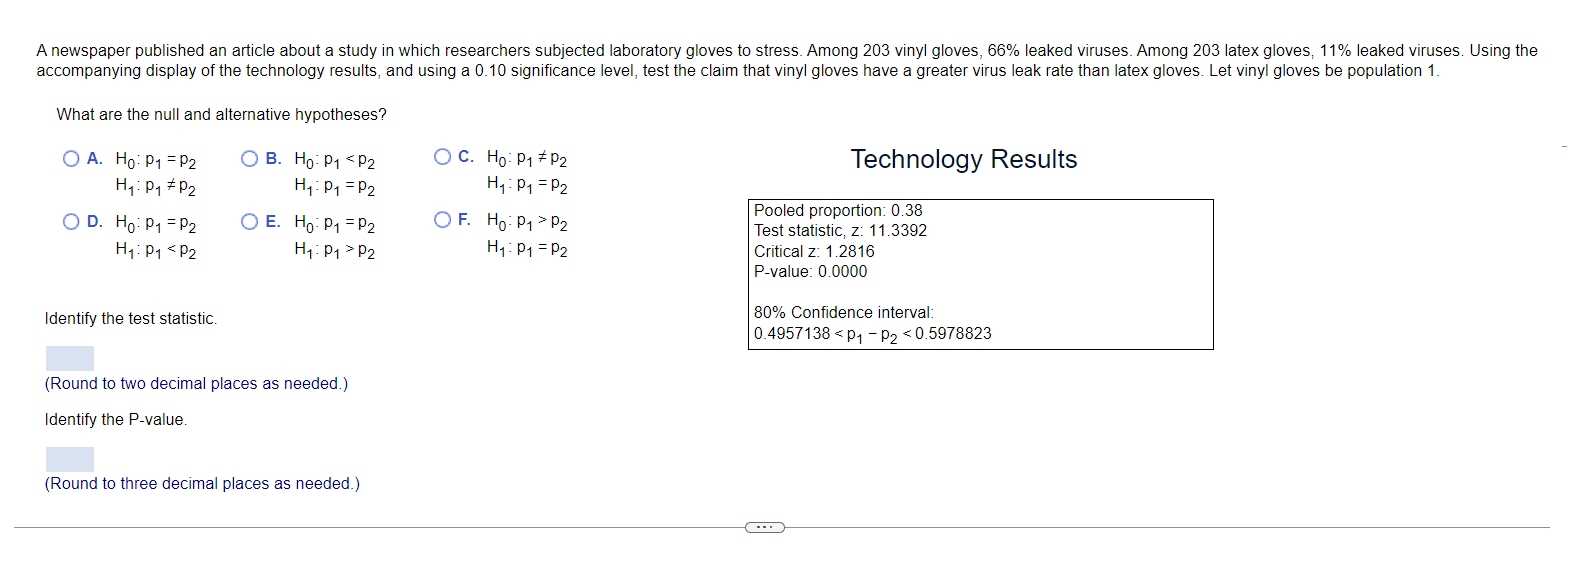
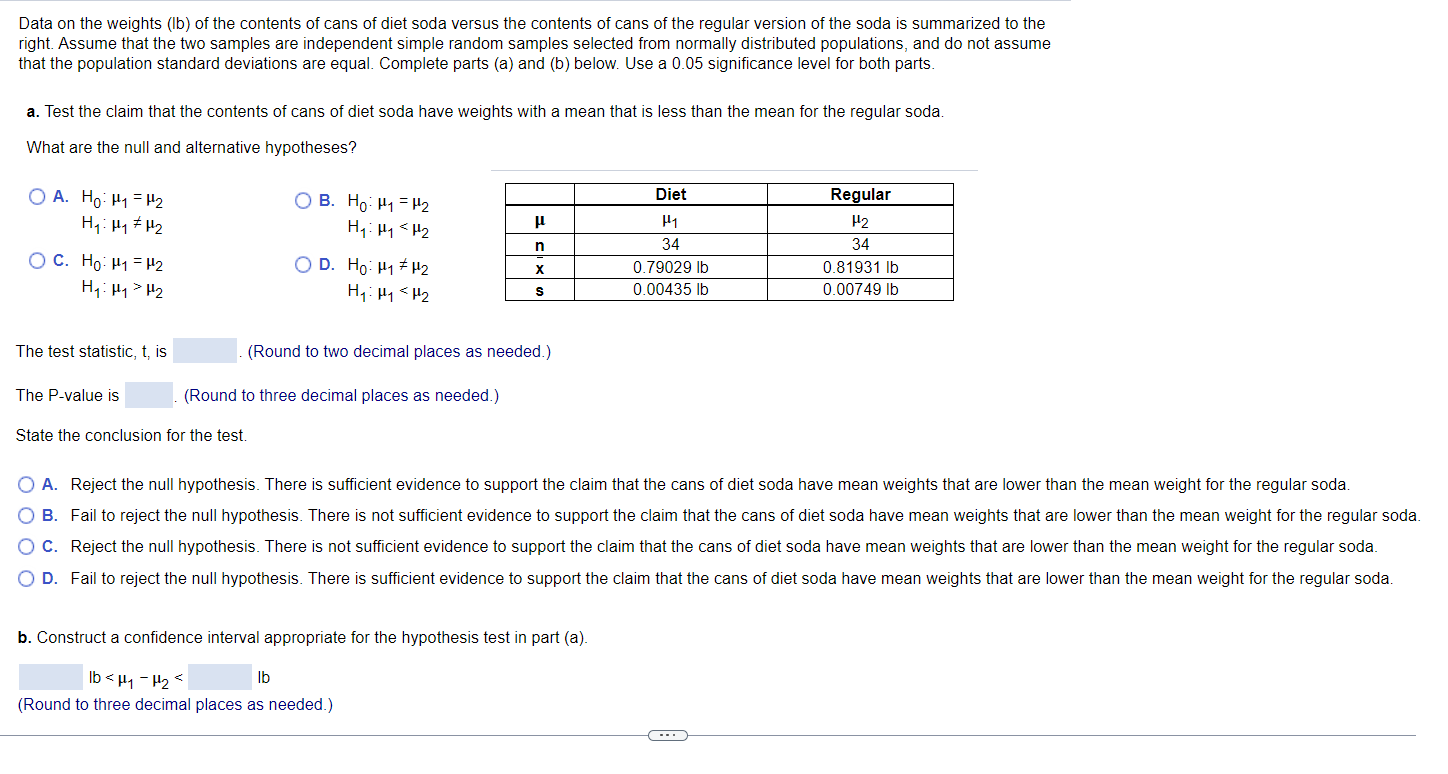
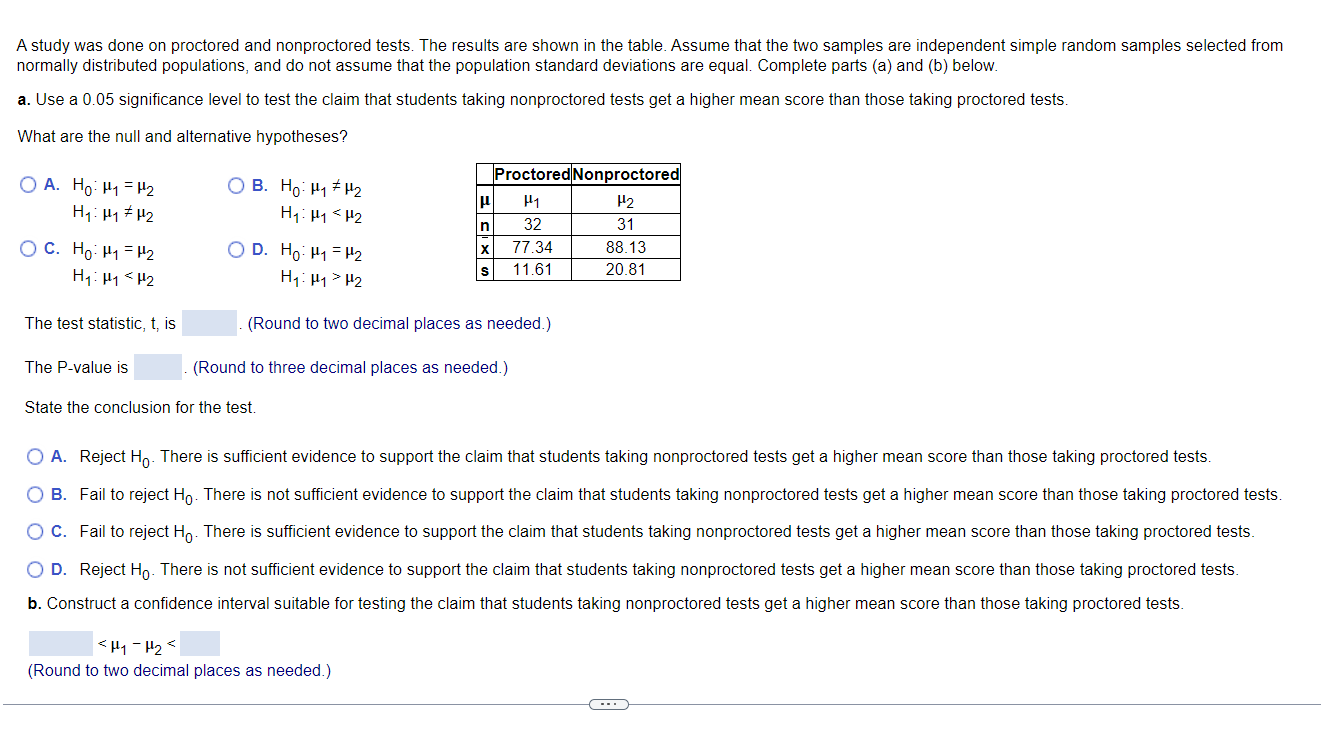

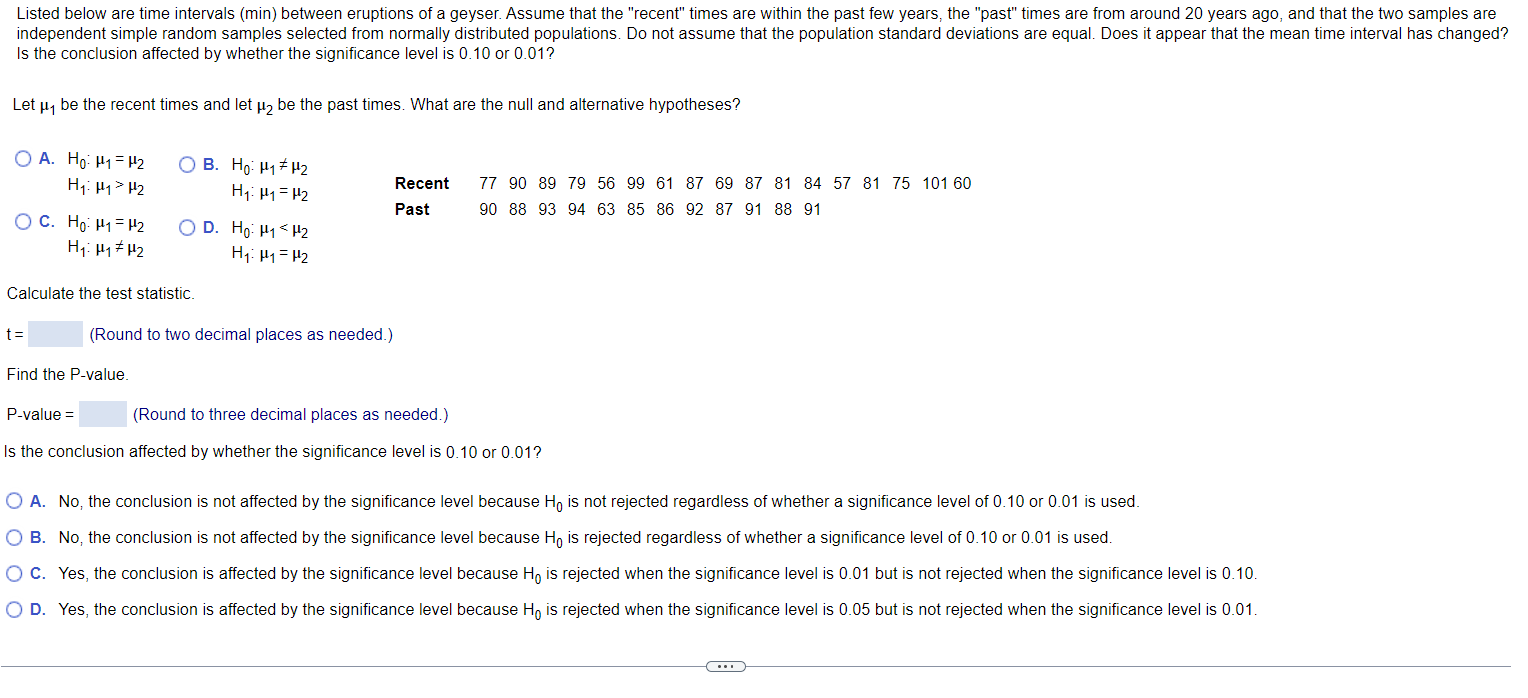
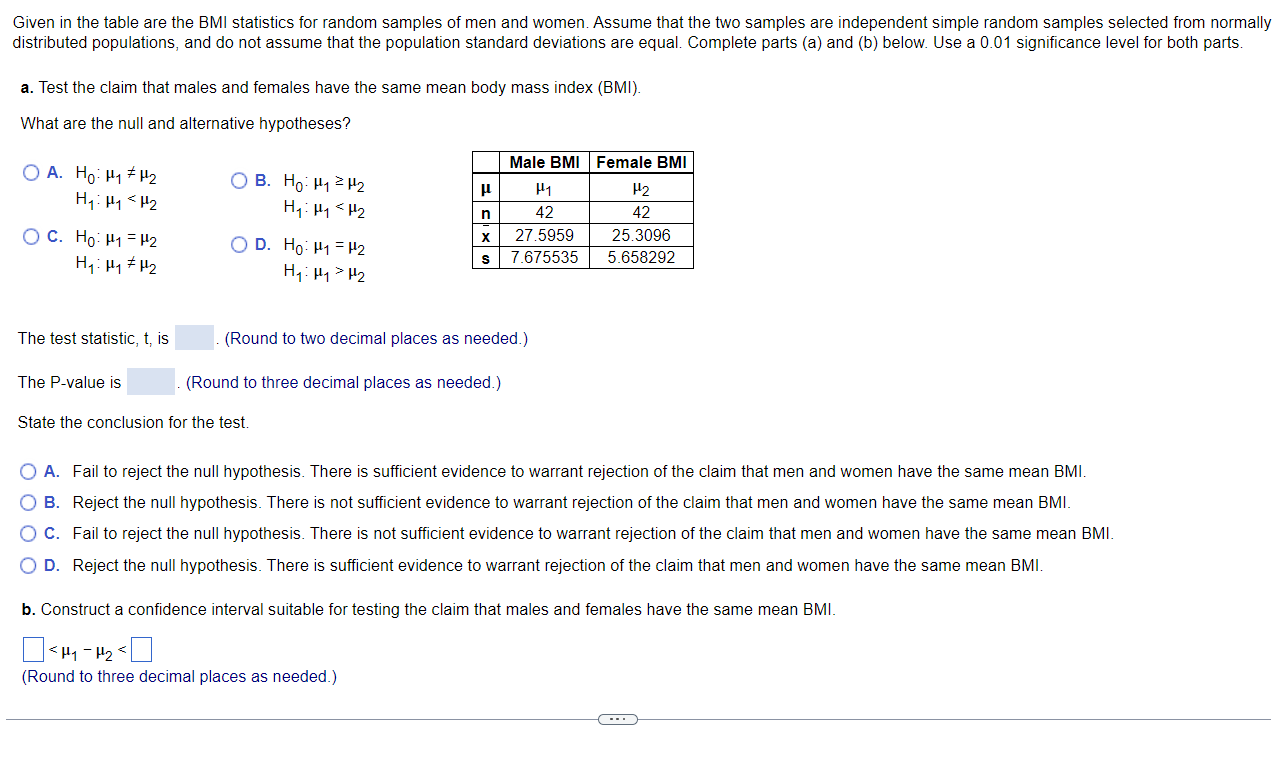
A newspaper published an article about a study in which researchers subjected laboratory gloves to stress. Among 203 vinyl gloves, 66% leaked viruses. Among 203 latex gloves, 11% leaked viruses. Using the accompanying display of the technology results, and using a 0.10 significance level, test the claim that vinyl gloves have a greater virus leak rate than latex gloves. Let vinyl gloves be population 1. What are the null and alternative hypotheses? O A. Ho: P1 = P2 O B. Ho: P1 = P2 O C. Ho: P1 * P2 Technology Results Hy: P1 / P2 Hy : P1 = P2 Hy : P1 = P2 Pooled proportion: 0.38 O D. Ho: P1 = P2 O E. Ho: P1 = P2 OF. Ho: P1 > P2 Test statistic, z: 11.3392 H1 : P1 = P2 H1 : P1 > P2 Hy : P1 = P2 Critical z: 1.2816 P-value: 0.0000 Identify the test statistic. 80% Confidence interval: 0.4957138 \"2 H1 p. H2 S 11.61 20.81 The test statistic, t, is (Round to two decimal places as needed.) The P-value is (Round to three decimal places as needed.) State the conclusion for the test. O A. Reject Ho. There is sufficient evidence to support the claim that students taking nonproctored tests get a higher mean score than those taking proctored tests. O B. Fail to reject Ho. There is not sufficient evidence to support the claim that students taking nonproctored tests get a higher mean score than those taking proctored tests. O C. Fail to reject Ho. There is sufficient evidence to support the claim that students taking nonproctored tests get a higher mean score than those taking proctored tests. O D. Reject Ho. There is not sufficient evidence to support the claim that students taking nonproctored tests get a higher mean score than those taking proctored tests. b. Construct a confidence interval suitable for testing the claim that students taking nonproctored tests get a higher mean score than those taking proctored tests. = Hy - 12 = (Round to two decimal places as needed.)Given in the table are the BMI statistics for random samples of men and women. Assume that the two samples are independent simple random samples selected from normally distributed populations, and do not assume that the population standard deviations are equal. Complete parts (a) and (b) below Use a O 01 significance level for both parts. a. Test the claim that males and females have the same mean body mass index (BMI) What are the null and alternative hypotheses? 5.1 A H _ 2' Male BMI Female BMI . 0. H1 - H2 {'1 B. H02u12p2 ll \"1 H2 HT \"1 (\"2 H1- H1 (\"2 n 42 42 -."'.1 C. H : = . , i 2?.5959 25.3096 " H0. H1 1-\"2 1 D' HO' \"1 ' \"2 s 7 @5535 5 658292 1P1-ll2 H1.|.L1>|.I2 ' V The test statistic, t' is . (Round to two decimal places as needed.) The Pvalue is . (Round to three decrmal places as needed.) State the conclusion for the test. [.1 A. Fall to reject the null hypothesrs There is sufficient evrdence to warrant rejection of the claim that men and women have the same mean Bl'vll. {'1 B. Reject he null hypothesis. There is not sufficient evidence to warrant rejection ofthe claim that men and women have the same mean BMI. {'1 C. Fail to reject the null hypothesis There is not sufficient evidence to warrant rejection of the claim that men and women have the same mean BMI. {'1 D. Reject t'ie null hypothesis. There is sufficient eVidence to warrant rejection of the claim that men and women have the same mean BMI. [3. Construct a confidence interval suitable fortesting the claim that males and females have the same mean BMI. H2 Hy : H 1 = H2 Recent 77 90 89 79 56 99 61 87 69 87 81 84 57 81 75 101 60 Past 90 88 93 94 63 85 86 92 87 91 88 91 O C. Ho: H1 = 12 OD. HO H1 = H2 Hy: H1 # H2 H1: H1 = H2 Calculate the test statistic. t = (Round to two decimal places as needed.) Find the P-value. P-value = (Round to three decimal places as needed.) Is the conclusion affected by whether the significance level is 0.10 or 0.01? O A. No, the conclusion is not affected by the significance level because He is not rejected regardless of whether a significance level of 0.10 or 0.01 is used. O B. No, the conclusion is not affected by the significance level because He is rejected regardless of whether a significance level of 0. 10 or 0.01 is used. O C. Yes, the conclusion is affected by the significance level because He is rejected when the significance level is 0.01 but is not rejected when the significance level is 0. 10. O D. Yes, the conclusion is affected by the significance level because He is rejected when the significance level is 0.05 but is not rejected when the significance level is 0.01
Step by Step Solution
There are 3 Steps involved in it

Get step-by-step solutions from verified subject matter experts