

Question: Hello. Could you please help me with this practice homework I was not present for this 6. (SHOW WORK AND CLEARLY STATE THE ANSWER) The
Hello. Could you please help me with this practice homework I was not present for this
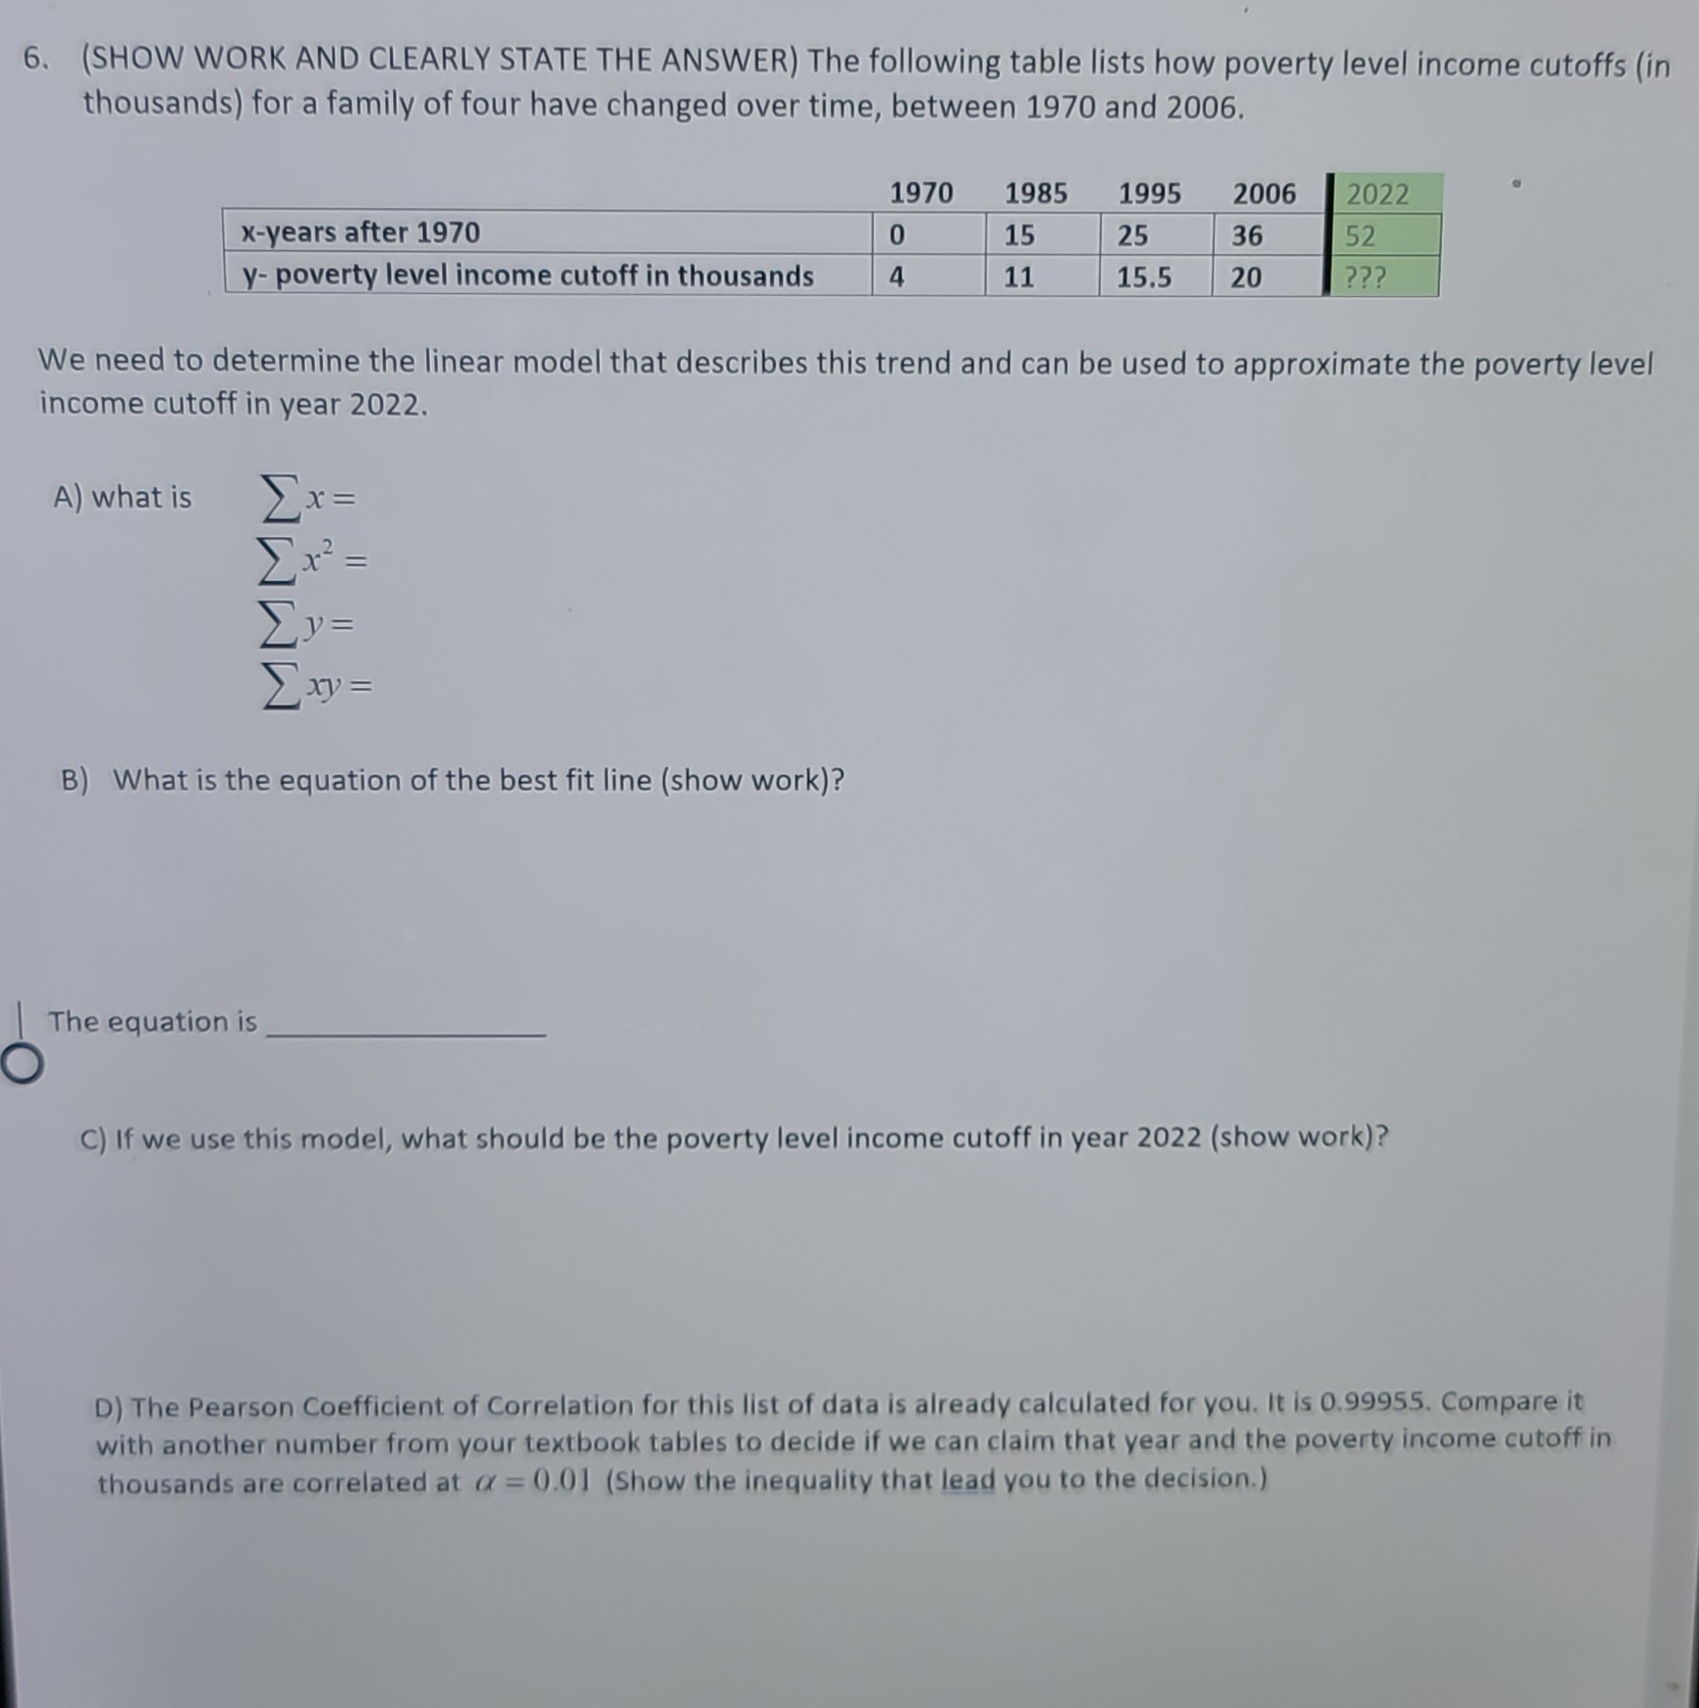
6. (SHOW WORK AND CLEARLY STATE THE ANSWER) The following table lists how poverty level income cutoffs (in thousands) for a family of four have changed over time, between 1970 and 2006. 1970 1985 1995 2006 2022 x-years after 1970 0 15 25 36 52 y- poverty level income cutoff in thousands 4 11 15.5 20 ??? We need to determine the linear model that describes this trend and can be used to approximate the poverty level income cutoff in year 2022. A) what is `X = L' 7-2 = V= xy = B) What is the equation of the best fit line (show work)? The equation is C) If we use this model, what should be the poverty level income cutoff in year 2022 (show work)? D) The Pearson Coefficient of Correlation for this list of data is already calculated for you. It is 0.99955. Compare it with another number from your textbook tables to decide if we can claim that year and the poverty income cutoff in thousands are correlated at o = 0.01 (Show the inequality that lead you to the decision.)
Step by Step Solution
There are 3 Steps involved in it

Get step-by-step solutions from verified subject matter experts