

Question: Hello could you please help me with this problem? I got all those answers wrong probably. Thank you! Often, frequency distributions are reported using unequal
Hello could you please help me with this problem? I got all those answers wrong probably.
Thank you!
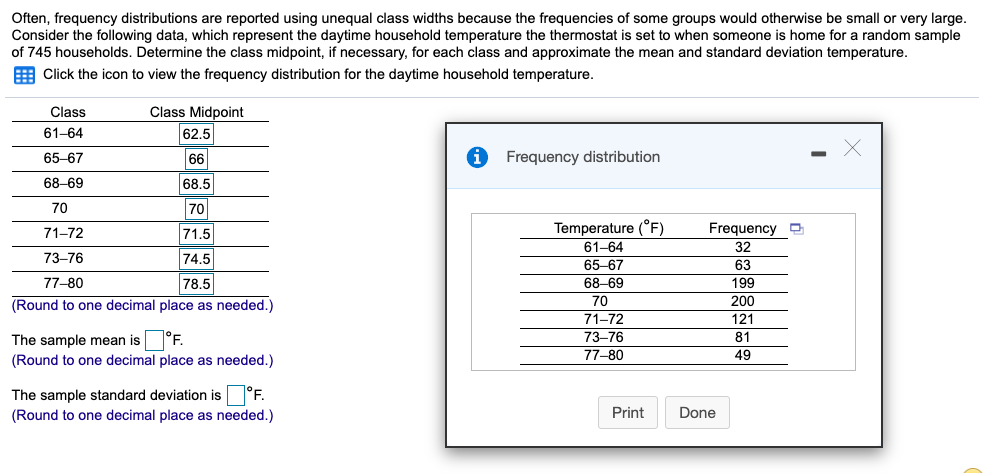
Often, frequency distributions are reported using unequal class widths because the frequencies of some groups would otherwise be small or very large. Consider the following data, which represent the daytime household temperature the thermostat is set to when someone is home for a random sample of 745 households. Determine the class midpoint, if necessary, for each class and approximate the mean and standard deviation temperature. Click the icon to view the frequency distribution for the daytime household temperature. Class Class Midpoint 61-64 62.5 65-67 66 i Frequency distribution - X 68-69 68.5 70 70 71-72 71.5 Temperature ("F) Frequency 61-64 32 73-76 74.5 65-67 63 77-80 78.5 68-69 199 (Round to one decimal place as needed.) 70 200 71-72 121 The sample mean is 73-76 81 (Round to one decimal place as needed.) 77-80 49 The sample standard deviation is F. (Round to one decimal place as needed.) Print Done
Step by Step Solution
There are 3 Steps involved in it

Get step-by-step solutions from verified subject matter experts