

Question: hello everyone, would like some help with this please 9:374 24houranswers.com 6 of 7 9.) The mean salary for nurses on Statistic Island (made-up place)
hello everyone, would like some help with this please
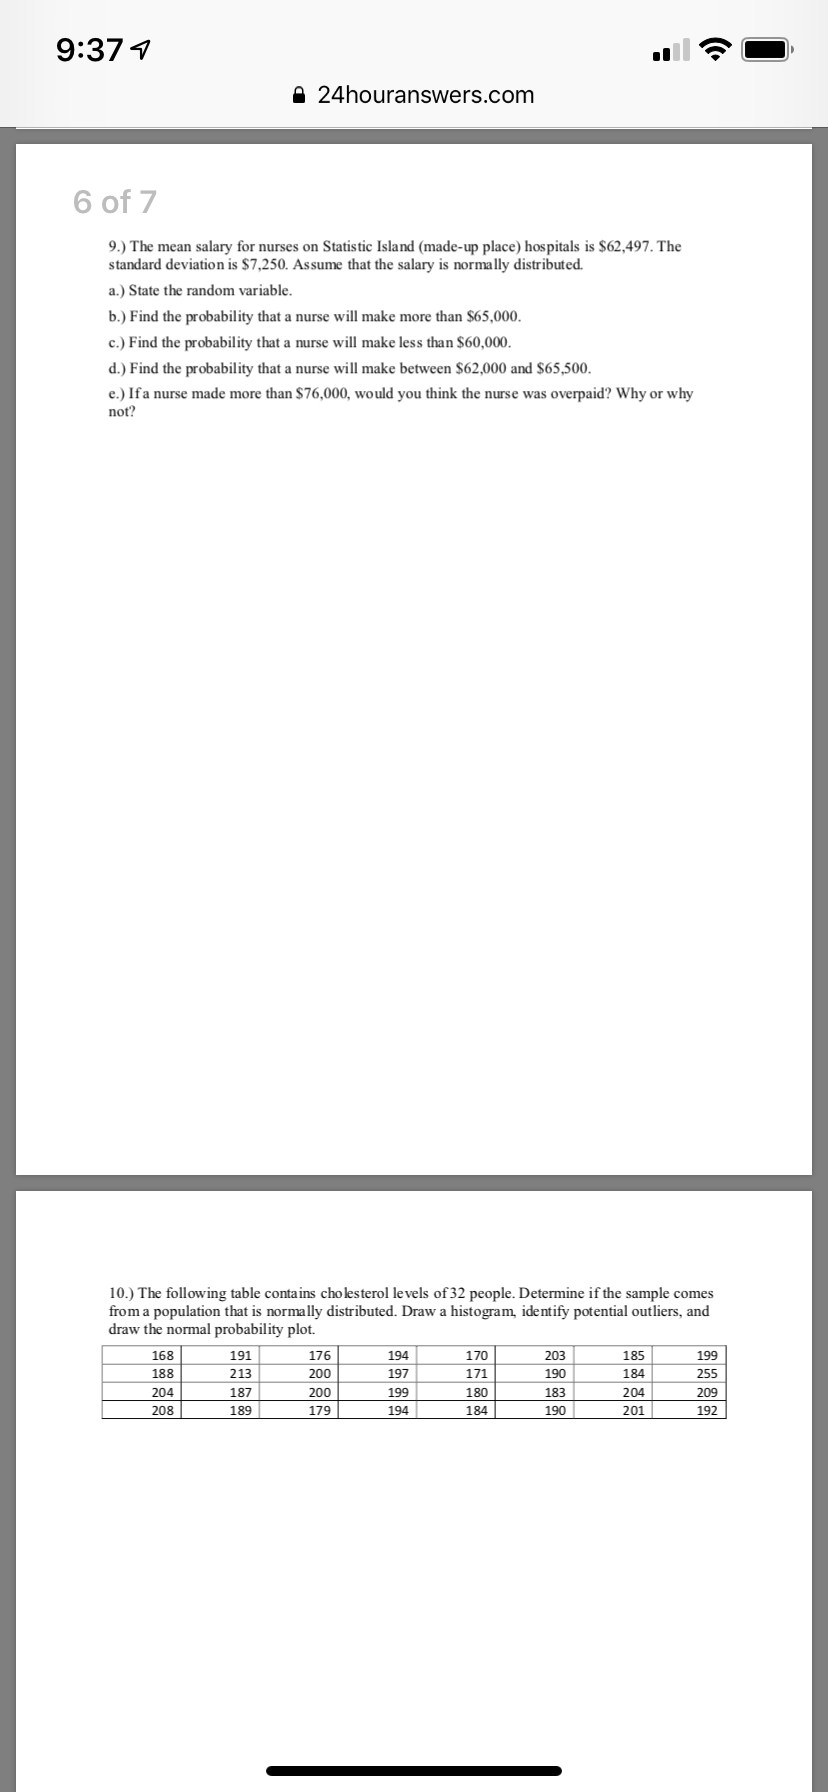
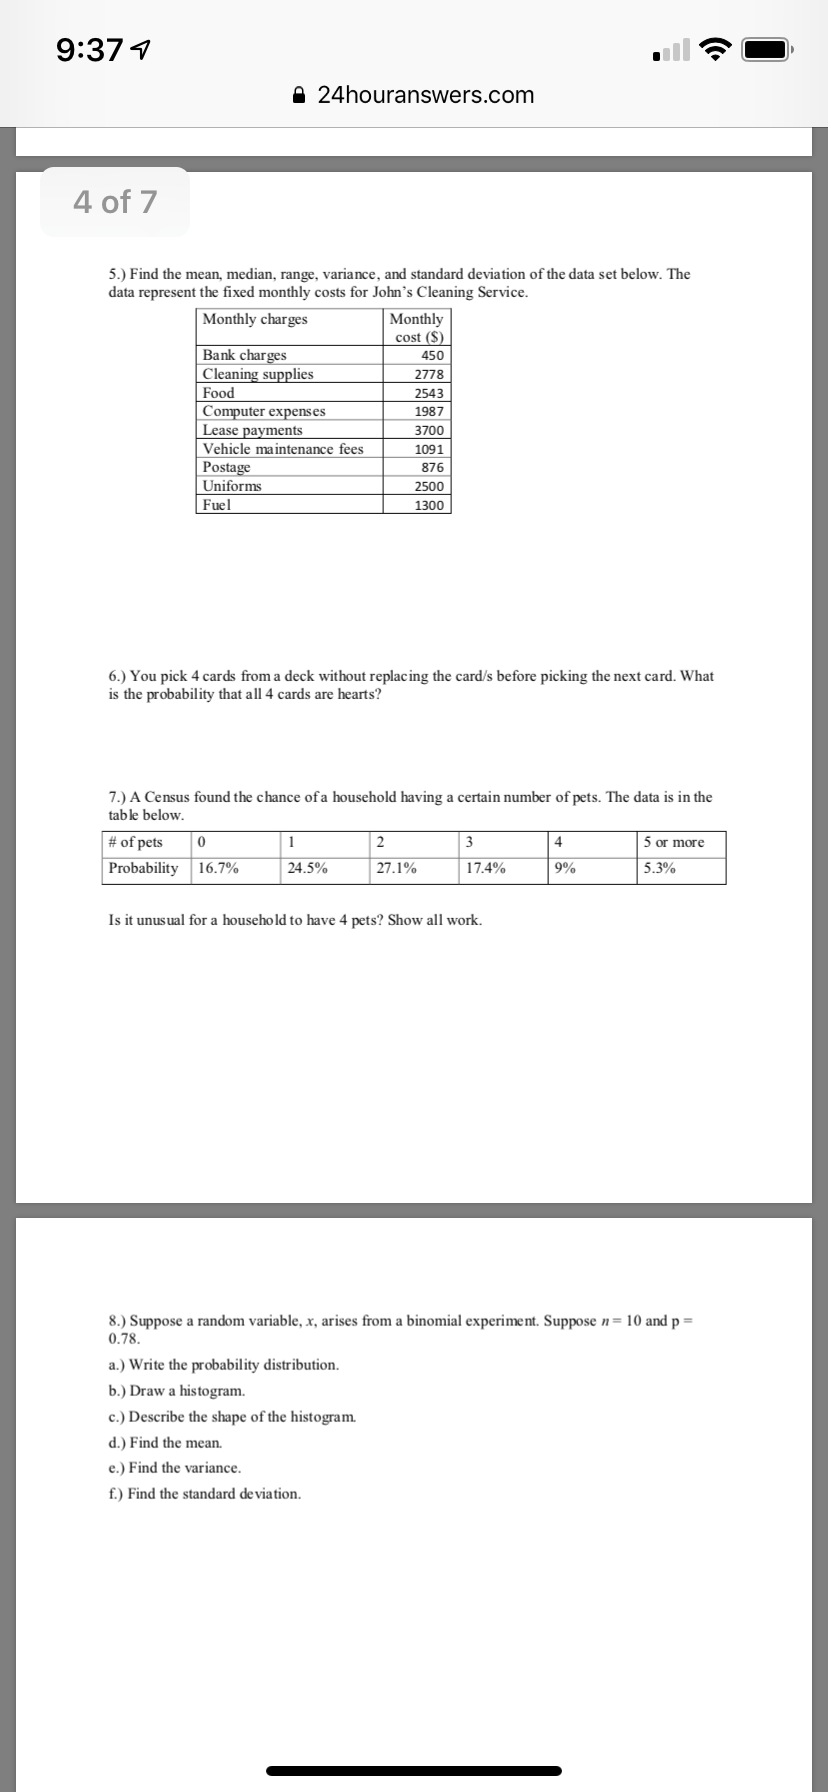
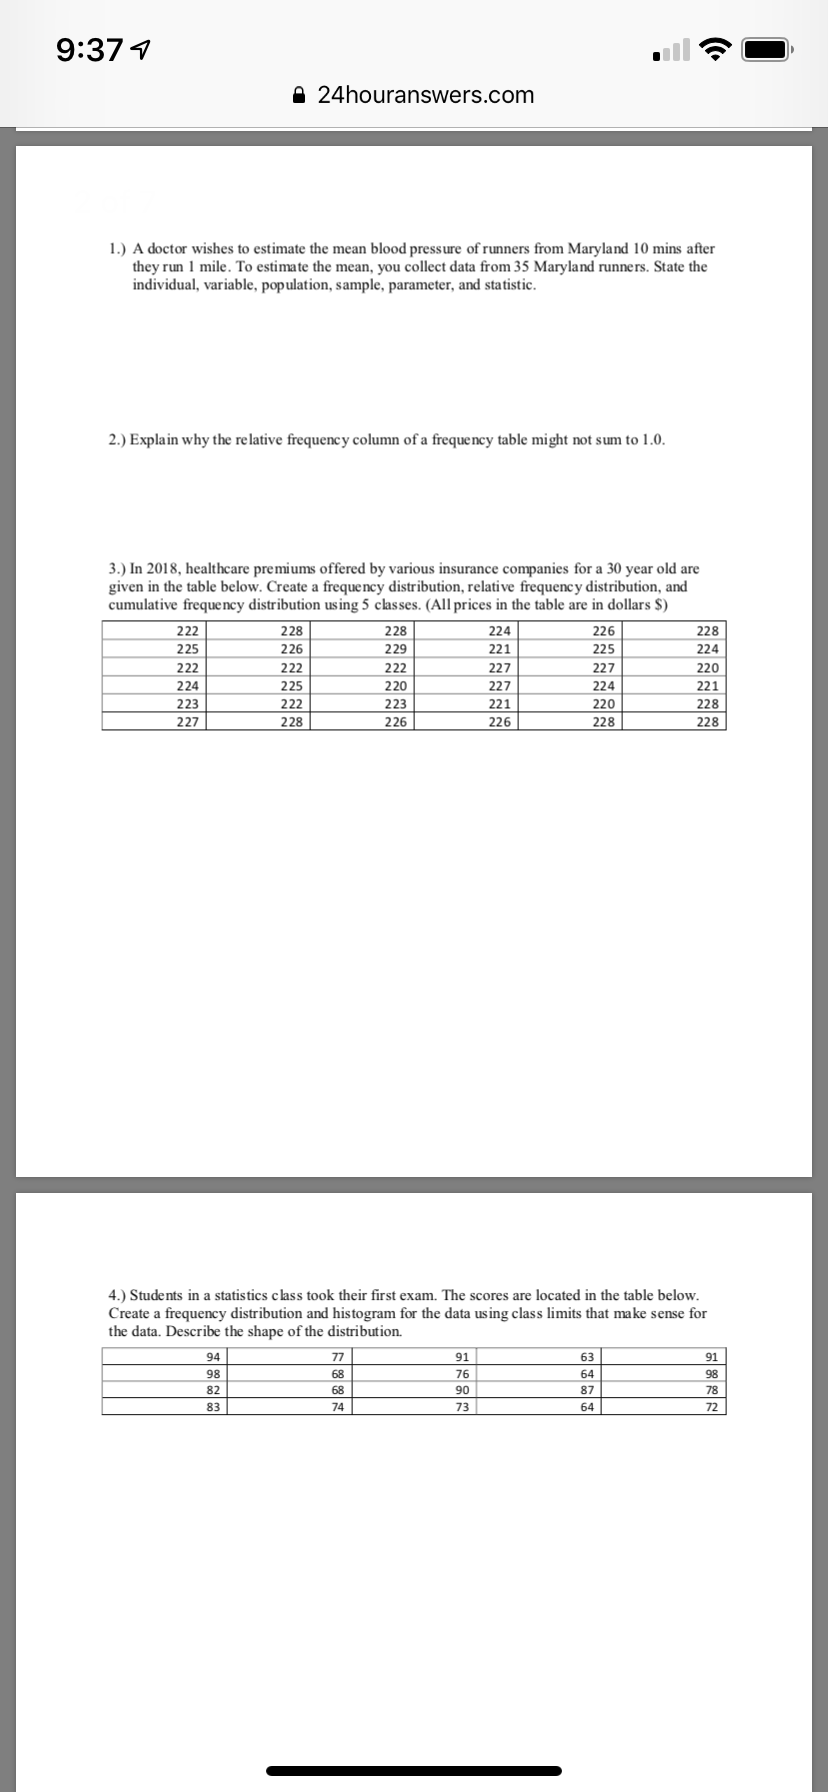
9:374 24houranswers.com 6 of 7 9.) The mean salary for nurses on Statistic Island (made-up place) hospitals is $62,497. The standard deviation is $7,250. Assume that the salary is normally distributed. a.) State the random variable. b.) Find the probability that a nurse will make more than $65,000. c.) Find the probability that a nurse will make less than $60,000. d.) Find the probability that a nurse will make between $62,000 and $65,500. e.) If a nurse made more than $76,000, would you think the nurse was overpaid? Why or why not? 10.) The following table contains cholesterol levels of 32 people. Determine if the sample comes from a population that is normally distributed. Draw a histogram, identify potential outliers, and draw the normal probability plot. 168 191 176 194 170 203 185 199 188 213 200 197 171 190 184 255 204 187 200 199 180 183 204 209 208 189 179 194 184 190 201 1929:374 24houranswers.com 4 of 7 5.) Find the mean, median, range, variance, and standard deviation of the data set below. The data represent the fixed monthly costs for John's Cleaning Service. Monthly charges Monthly cost ($) Bank charges 450 Cleaning supplies 2778 Food 2543 Computer expenses 1987 Lease payments 3700 Vehicle maintenance fees 1091 Postage 876 Uniforms 2500 Fuel 1300 6.) You pick 4 cards from a deck without replacing the card/s before picking the next card. What is the probability that all 4 cards are hearts? 7.) A Census found the chance of a household having a certain number of pets. The data is in the table below. # of pets 0 2 3 4 5 or more Probability 16.7% 24.5% 27.1% 17.4% 9% 5.3% Is it unusual for a household to have 4 pets? Show all work. 8.) Suppose a random variable, x, arises from a binomial experiment. Suppose n = 10 and p = 0.78. a.) Write the probability distribution. b.) Draw a histogram. c.) Describe the shape of the histogram. d.) Find the mean. e.) Find the variance. f.) Find the standard deviation.9:374 24houranswers.com 1.) A doctor wishes to estimate the mean blood pressure of runners from Maryland 10 mins after they run 1 mile. To estimate the mean, you collect data from 35 Maryland runners. State the individual, variable, population, sample, parameter, and statistic. 2.) Explain why the relative frequency column of a frequency table might not sum to 1.0. 3.) In 2018, healthcare premiums offered by various insurance companies for a 30 year old are given in the table below. Create a frequency distribution, relative frequency distribution, and cumulative frequency distribution using 5 classes. (All prices in the table are in dollars $) 222 228 228 224 226 228 225 226 229 221 225 224 222 222 222 227 227 220 224 225 220 227 224 221 223 222 223 221 220 228 227 228 226 226 228 228 4.) Students in a statistics class took their first exam. The scores are located in the table below. Create a frequency distribution and histogram for the data using class limits that make sense for the data. Describe the shape of the distribution. 94 98 68 91 76 63 64 91 82 68 90 87 78 83 74 73 64 72
Step by Step Solution
There are 3 Steps involved in it

Get step-by-step solutions from verified subject matter experts