

Question: Hello ew Insert Format Arrange Tools Slide Show Window Help OFF Week 5_Quiz1 Prep Q. . Search in Presentat Design Transitions Animations Slide Show Review
Hello
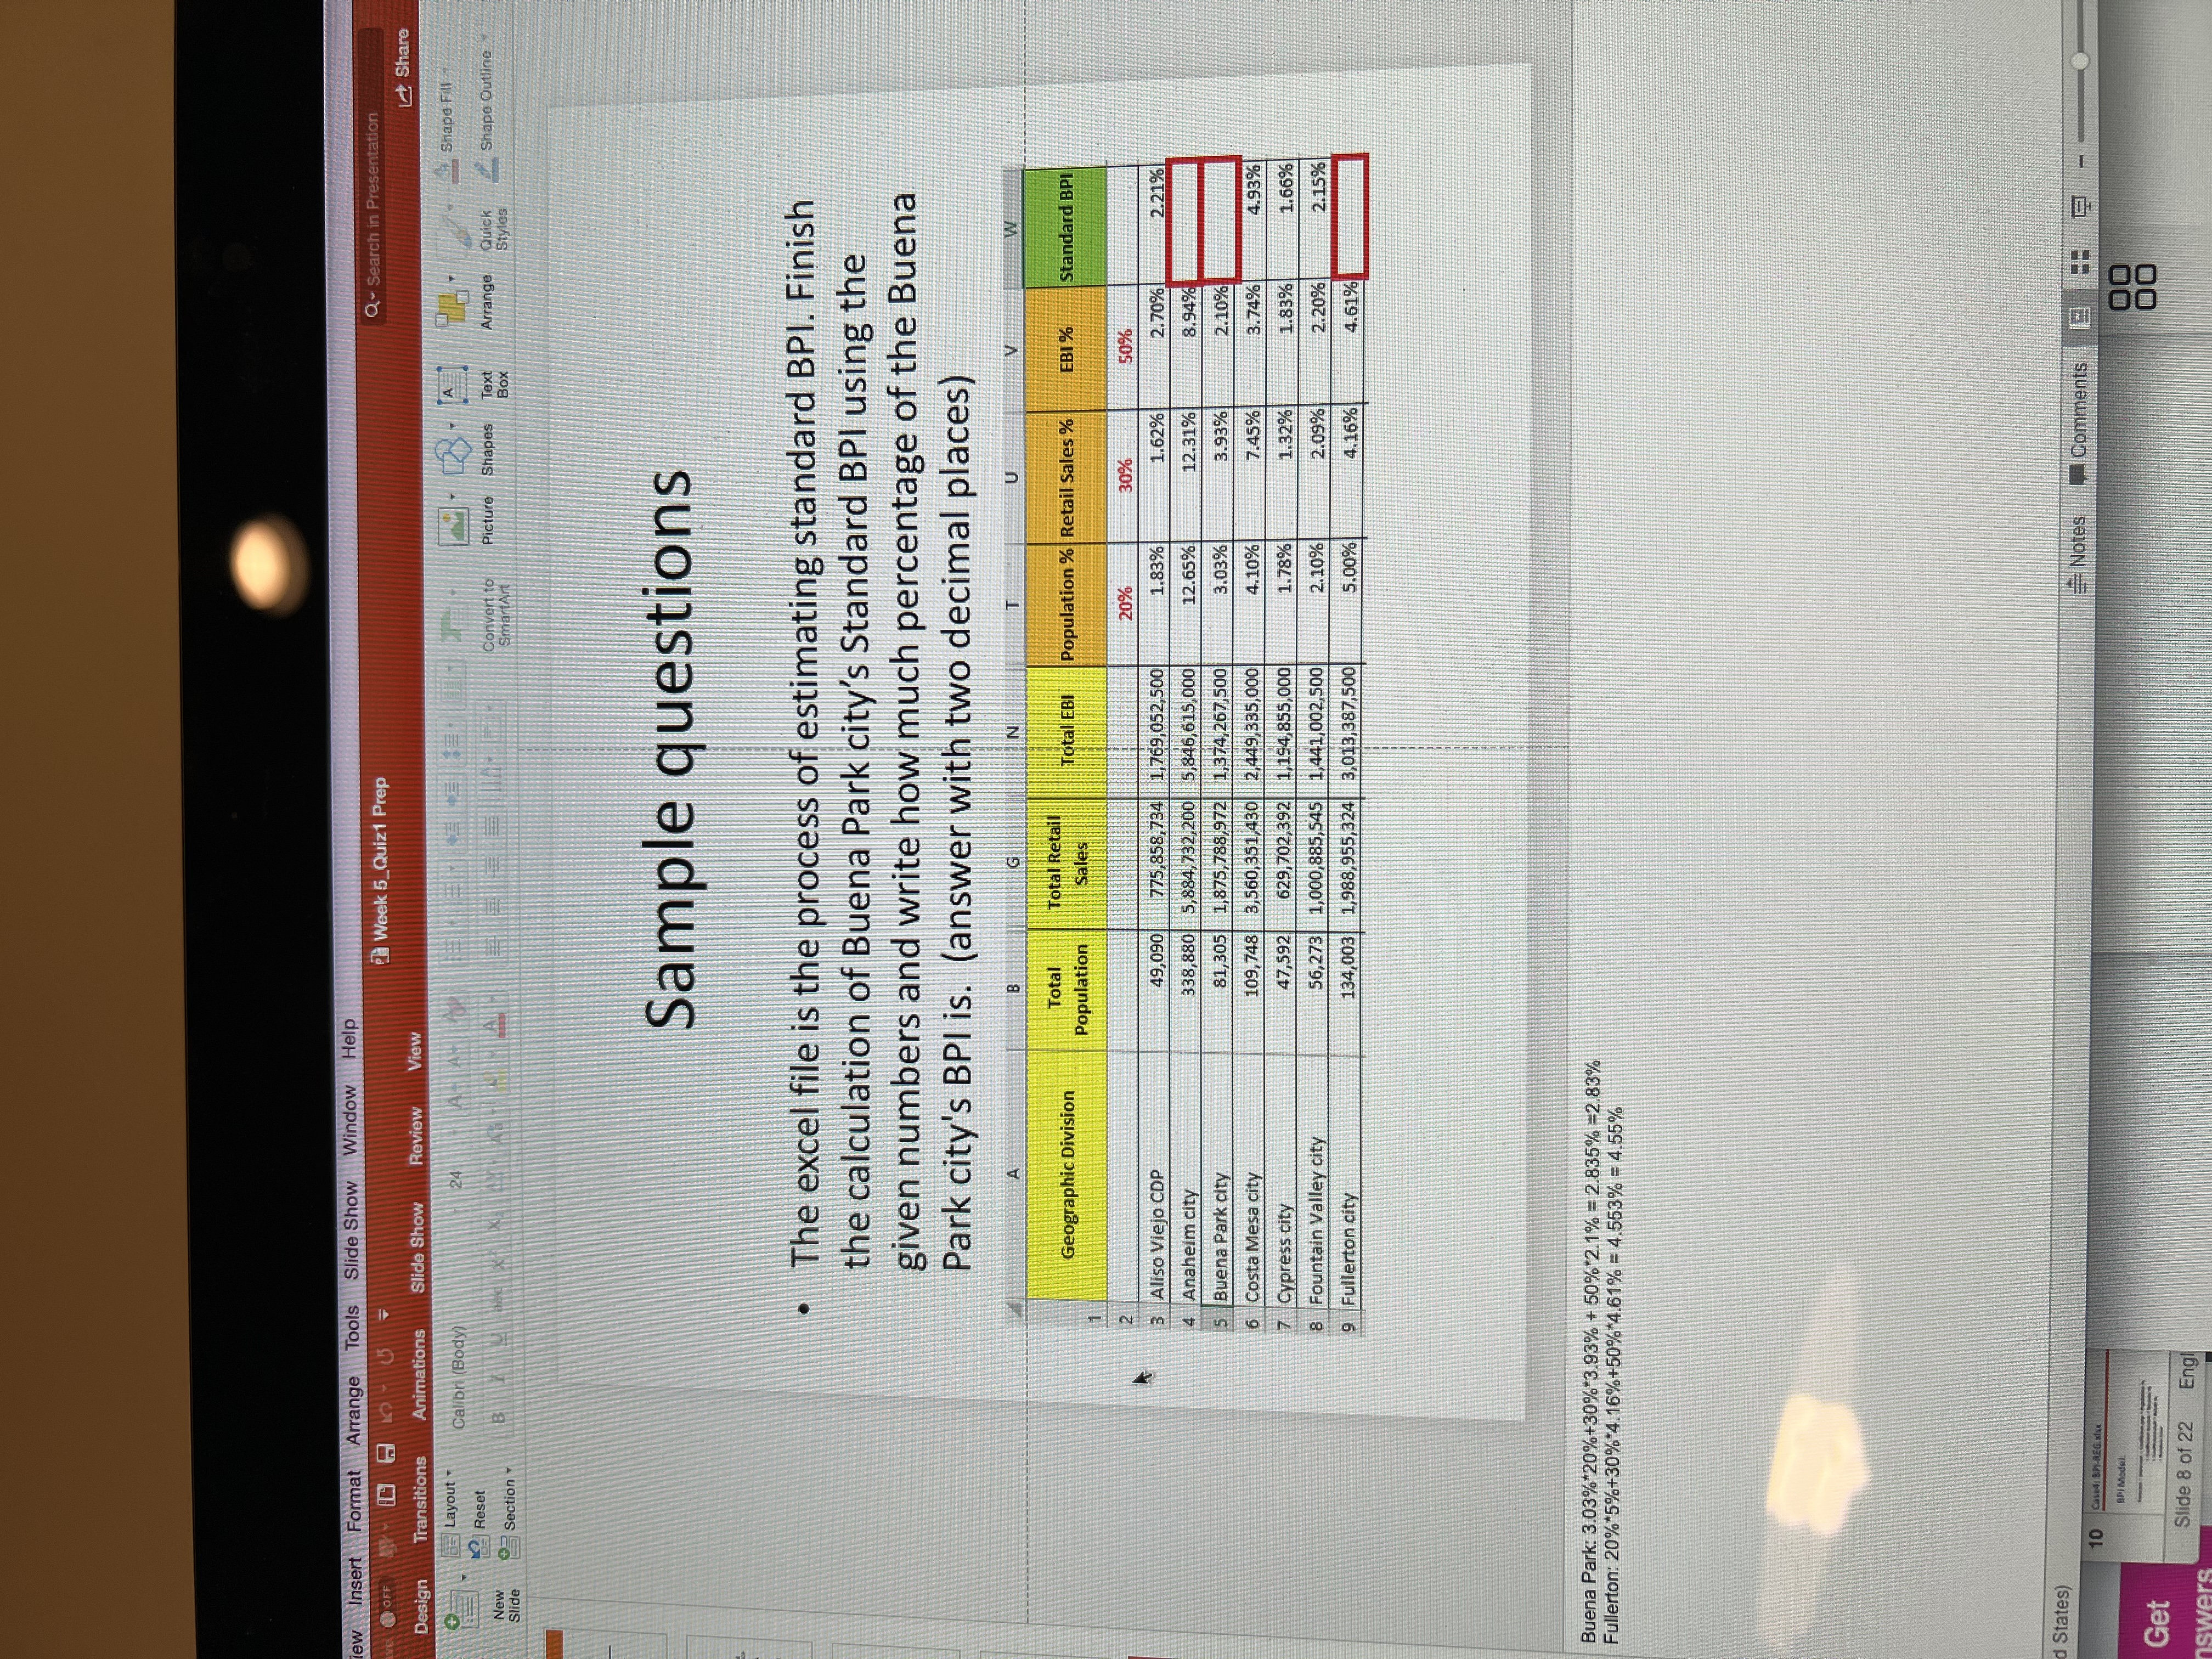
ew Insert Format Arrange Tools Slide Show Window Help OFF Week 5_Quiz1 Prep Q. . Search in Presentat Design Transitions Animations Slide Show Review View Share Layout Calibri (Body 24 & Snape Fill Reset New Section Convert to Picture Shapes BOX Arrange Quick Shape Outline Slide SmartArt Styles Sample questions . The excel file is the process of estimating standard BPI. Finish the calculation of Buena Park city's Standard BPI using the given numbers and write how much percentage of the Buena Park city's BPI is. (answer with two decimal places) Total Geographic Division Total Retail Population Sales Total EBI Population % Retail Sales % BI % Standard BPI 2 20% 30% 50% 3 Aliso Viejo CDP 19,090 775,858,734 1,769,052,500 1,83% 1.62% 2.70% 2.21% 4 Anaheim city 38,880 5,884, 732,200 5,846,615,000 12.65% 12.31% 3.94% Buena Park city 31,305 1,875,788,972 1,374,267,500 3.03% 3.93% 2.10% 6 Costa Mesa city 109,748 3,560,351,430 2,449,335,000 4.10% 7.45% 3.74% 1.93% 7 Cypress city 7,592 629,702,392 1,194,855,000 .78% 1.32% 1.83% 1.66% 8 Fountain Valley city 56,273 1,000,885,545 1,441,002,500 2.10% 2.09% 2.20% 2.15% 9 Fullerton city 134,003 1,988,955,324 3,013,387 500 5.00% 4.16% 4.61% Buena Park: 3.03%*20%+30%*3.93% + 50% 2.1% - 2.835% -2.83% Fullerton: 20%*5%+30%*4.16%+50%*4.61% = 4.553% = 4.55% d States) 10 COUN BM-REG. shak Notes Comments 8 =: 5 API Model Get Slide 8 of 22 Eng
Step by Step Solution
There are 3 Steps involved in it

Get step-by-step solutions from verified subject matter experts