

Question: Hello Gurus. Please help with editing the Python codes below. I want it to plot the graph of y against x. Using the codes below,
 Hello Gurus. Please help with editing the Python codes below. I want it to plot the graph of y against x. Using the codes below, it kept giving the message: "TypeError: float() argument must be a string or a number, not 'function'". Help rectify it. Thanks
...............................................................................................
import matplotlib.pyplot as plt import numpy as np import math
#Constants h = 6.626e-34 h1=(h/2*math.pi) m = 500 k1=0.3 c=1/math.sqrt(2*math.pi) x1=1.5 c1=(h1**2)/(4*m**2*x1**4)
#Values for x and t x = np.linspace(-300, 300, 1)
t = np.linspace (0,250)
#Function definitions def y1(t):
return np.c1*np.t**2
def y2(y1, t):
return (1+(np.y1))
def y3(y2,t):
return np.y2**(1/2)
def y4(y3, t):
return (2*math.pi)*c**2p.y3
def y5(x2, y2, x1):
return (np.x2)/(2*(np.x1**2)*np.y2)
def x2(x,t):
return (np.x-((h1*k1/m)*np.t))
def y(y4, y5):
return str(np.y4*(math.exp(-(np.y5))))
def y_p(y): "{:.}".format(y)
return y_p
def x_p(): "{}".format(x)
return x_p
plt.plot(x_p, y_p)
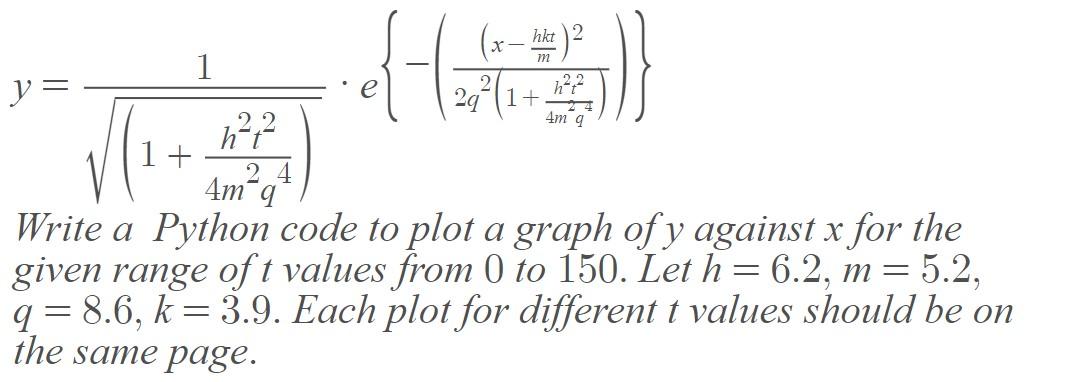
(.* - hkt 12 x m 1 {43) y = 1+ 4m 2 h22 1+ 4m, = = Write a Python code to plot a graph of y against x for the given range of t values from 0 to 150. Let h=6.2, m = 5.2, q = 8.6, k = 3.9. Each plot for different t values should be on the same page. =
Step by Step Solution
There are 3 Steps involved in it

Get step-by-step solutions from verified subject matter experts