

Question: Hello guys, I really need help with this assignment. Thank y'all in advance For problems 6- 8: A. Plot the points. B. If the data
Hello guys, I really need help with this assignment. Thank y'all in advance
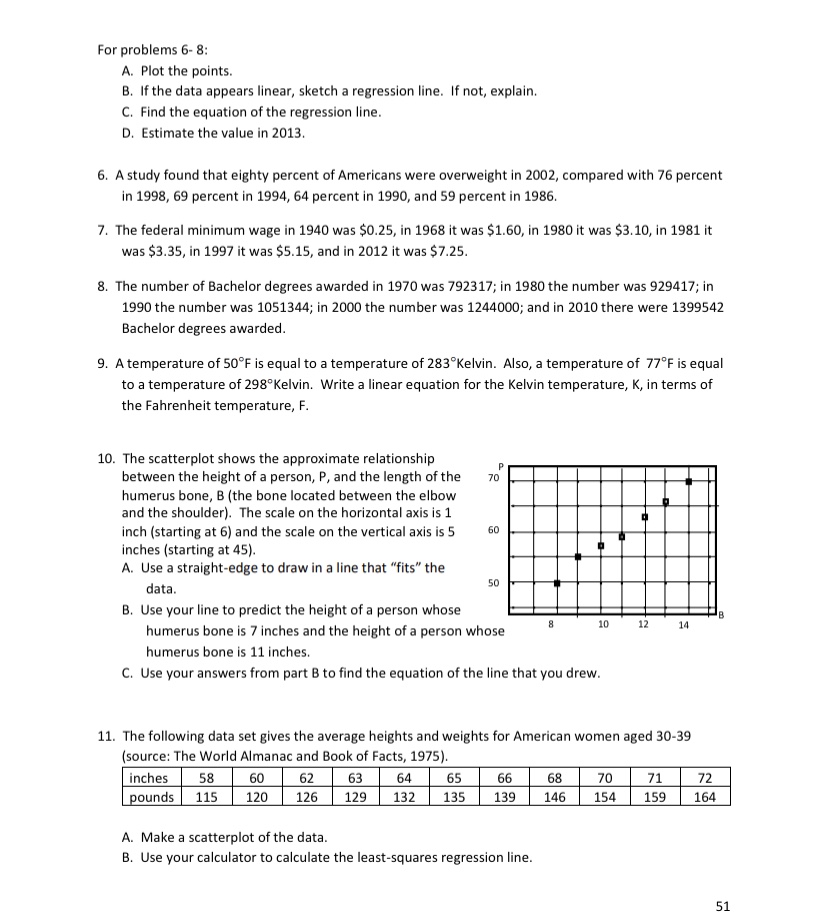
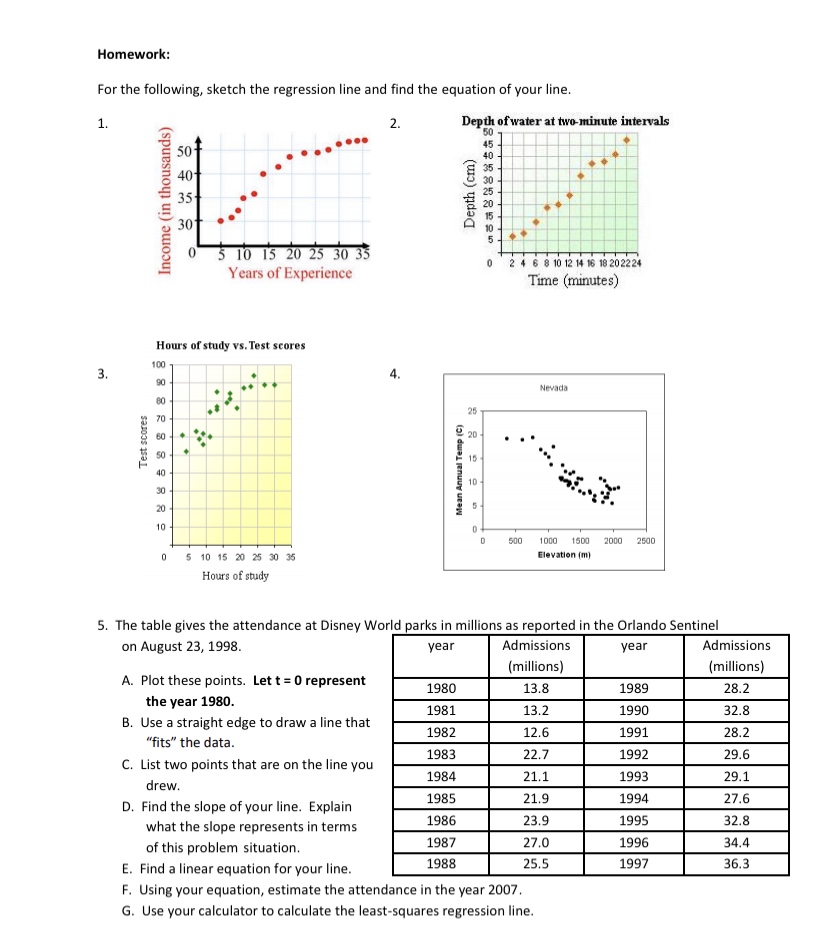
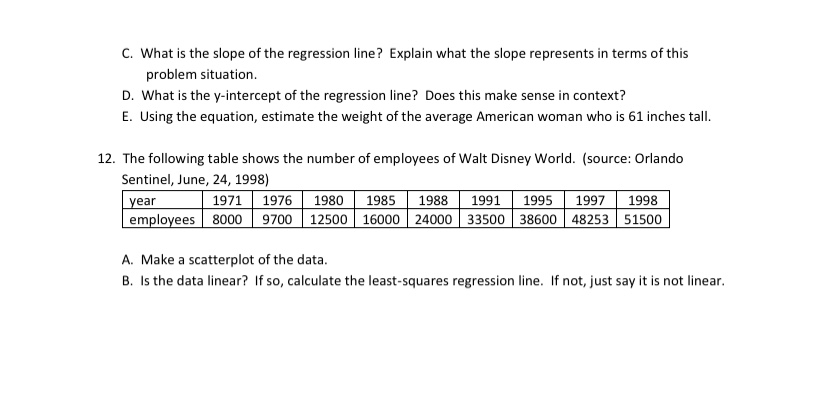
For problems 6- 8: A. Plot the points. B. If the data appears linear, sketch a regression line. If not, explain. C. Find the equation of the regression line. D. Estimate the value in 2013. 6. A study found that eighty percent of Americans were overweight in 2002, compared with 76 percent in 1998, 69 percent in 1994, 64 percent in 1990, and 59 percent in 1986. 7. The federal minimum wage in 1940 was $0.25, in 1968 it was $1.60, in 1980 it was $3.10, in 1981 it was $3.35, in 1997 it was $5.15, and in 2012 it was $7.25. 8. The number of Bachelor degrees awarded in 1970 was 792317; in 1980 the number was 929417; in 1990 the number was 1051344; in 2000 the number was 1244000; and in 2010 there were 1399542 Bachelor degrees awarded. 9. A temperature of 50F is equal to a temperature of 283"Kelvin. Also, a temperature of 77'F is equal to a temperature of 298"Kelvin. Write a linear equation for the Kelvin temperature, K, in terms of the Fahrenheit temperature, F. 10. The scatterplot shows the approximate relationship between the height of a person, P, and the length of the humerus bone, B (the bone located between the elbow and the shoulder). The scale on the horizontal axis is 1 inch (starting at 6) and the scale on the vertical axis is 5 60 inches (starting at 45). A. Use a straight-edge to draw in a line that "fits" the data. 50 B. Use your line to predict the height of a person whose humerus bone is 7 inches and the height of a person whose 10 14 humerus bone is 11 inches. C. Use your answers from part B to find the equation of the line that you drew. 11. The following data set gives the average heights and weights for American women aged 30-39 (source: The World Almanac and Book of Facts, 1975). inches 58 60 62 63 64 65 66 68 70 71 72 pounds 115 120 126 129 132 135 139 146 154 159 164 A. Make a scatterplot of the data. B. Use your calculator to calculate the least-squares regression line.Homework: For the following, sketch the regression line and find the equation of your line. 1. Income (in thousands) 2. Depth of water at two-minute intervals 501 . ... *50 - 40 35 30t Depth (cm) 0 5 10 15 20 25 30 35 Years of Experience 0 2 4 6 8 10 12 14 16 18 20 22 24 Time (minutes) Hours of study vs. Test scores 3. 100 4. Nevada Test scores 6 8 8 8 8 8 3 8 8 26 Mean Annual Temp 20 500 1000 1500 2000 2500 5 10 15 20 25 30 35 Elevation (m) Hours of study 5. The table gives the attendance at Disney World parks in millions as reported in the Orlando Sentinel on August 23, 1998. year Admissions year Admissions A. Plot these points. Let t = 0 represent (millions) (millions) 1980 13.8 198 28.2 the year 1980. B. Use a straight edge to draw a line that 198: 13.2 1990 32.8 "fits" the data. 198 12.6 1991 28.2 C. List two points that are on the line you 1983 22.7 1992 29.6 drew. 1984 21.1 1993 29.1 D. Find the slope of your line. Explain 1985 21.9 1994 17.6 what the slope represents in terms 1986 23.9 1995 32.8 of this problem situation. 1987 27.0 99 34.4 E. Find a linear equation for your line. 988 25.5 1997 36.3 F. Using your equation, estimate the attendance in the year 2007. G. Use your calculator to calculate the least-squares regression line.C. What is the slope of the regression line? Explain what the slope re presents in terms of this problem situation. D. What is the vintercept of the regression line? Does this make sense in -::onte:tt'iI E. Using the equation, estimate the weight of the average American woman who is 51 inches tail. 12. The following ta hie shows the number of employees of Walt Disney World. (source: Orlando Sentinel, June, 14, 1993} A. Make a scatterplot of the data. B. Is the data linear? If so, calculate the least-squares regression line. If not. just say it is not linear
Step by Step Solution
There are 3 Steps involved in it

Get step-by-step solutions from verified subject matter experts