

Question: Hello, Here is the first two question for this R studio project. It require us to create a data frame and make a plot. In
Hello, Here is the first two question for this R studio project. It require us to create a data frame and make a plot. In the next question, it require us to use dist function to calculate the distance. The specific question is:
Calculate the distances between all points. Use the dist function and pass in all rows and only columns 1:2 from cred.data. (We don't want to include column 3 because it is the label column). The other parameter is to specify the method as euclidean- notice that this is the default as you can see from the doc page for the dist function. What does the function return? Assign the call to dist to a variable named "dm.object". The call to dist results in a distance matrix of size 6X6, since we have 6 data points. Convert the object returned from the call to dist to a matrix. Use the as.matrix function and assign its return to the variable "dm", then print dm. Notice the diagonal values are the distances between the points themselves, which is 0.
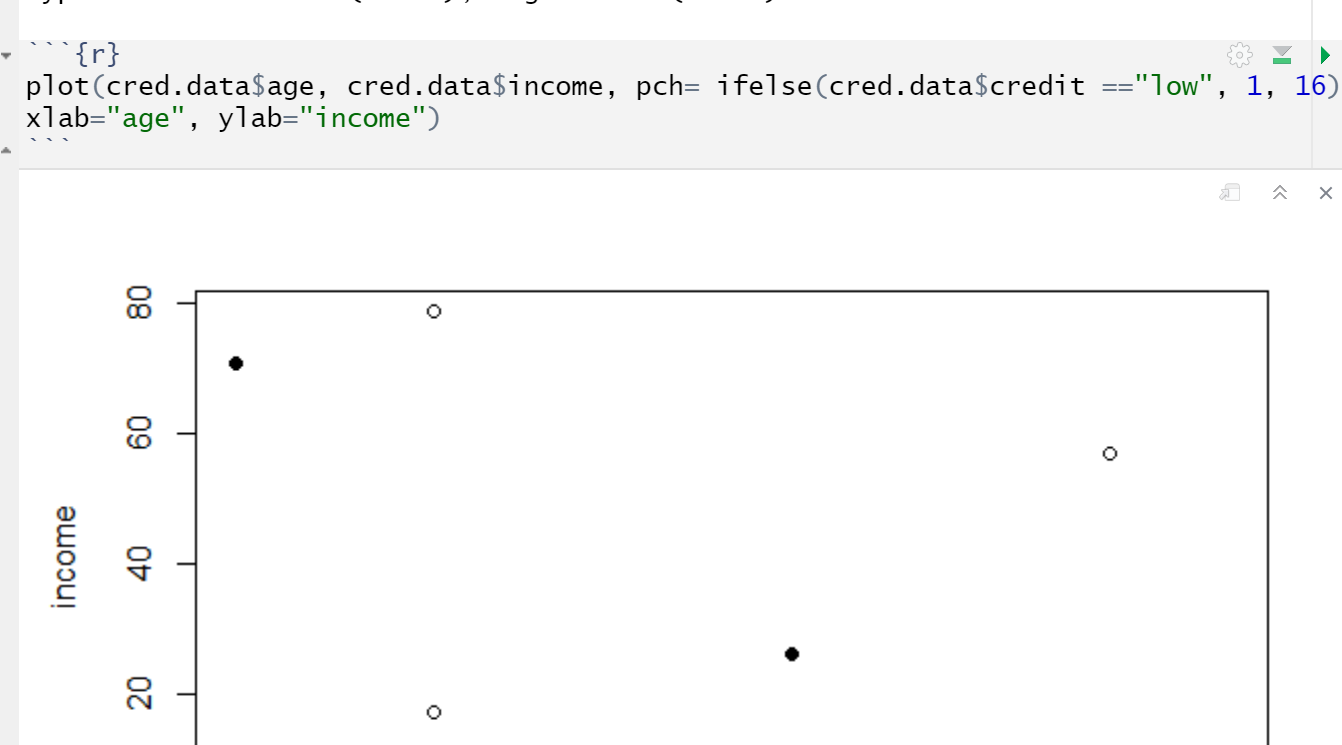
Once we have a distance metric, euclidean in our case, we can calculate a distance matrix of distances between all data points. Then, for a new point, we can calculate its distance to all other points, find the K nearest points, and assign the most common label to the new point. The following is a small example of how KNN works, with age and income as the variables, and credit as the label (Refer to the text, ch3, p78 as this code is very similar). Q1(2pts): Create a data frame using the function data.frame, called cred.data, that contains these vectors: age = 69,66,49,49,58,44 income = 3,57,79,17,26,71 credit = 'low', 'low', 'low', 'low', 'high','high' Note: you can use the data.frame method to do this easily. {r} age
Step by Step Solution
There are 3 Steps involved in it

Get step-by-step solutions from verified subject matter experts