

Question: hello here's Do Homework - Lab 4 - Google Chrome https://www.mathxl.com/Student/PlayerHomework.aspx?homeworkld=596494910&questionld=17&flushed=true&cld=64934728centerwin=yes ECON201EC - Summer 2021 Dennis Emond & | 05/26/21 2:10 PM Homework: Lab 4
hello here's
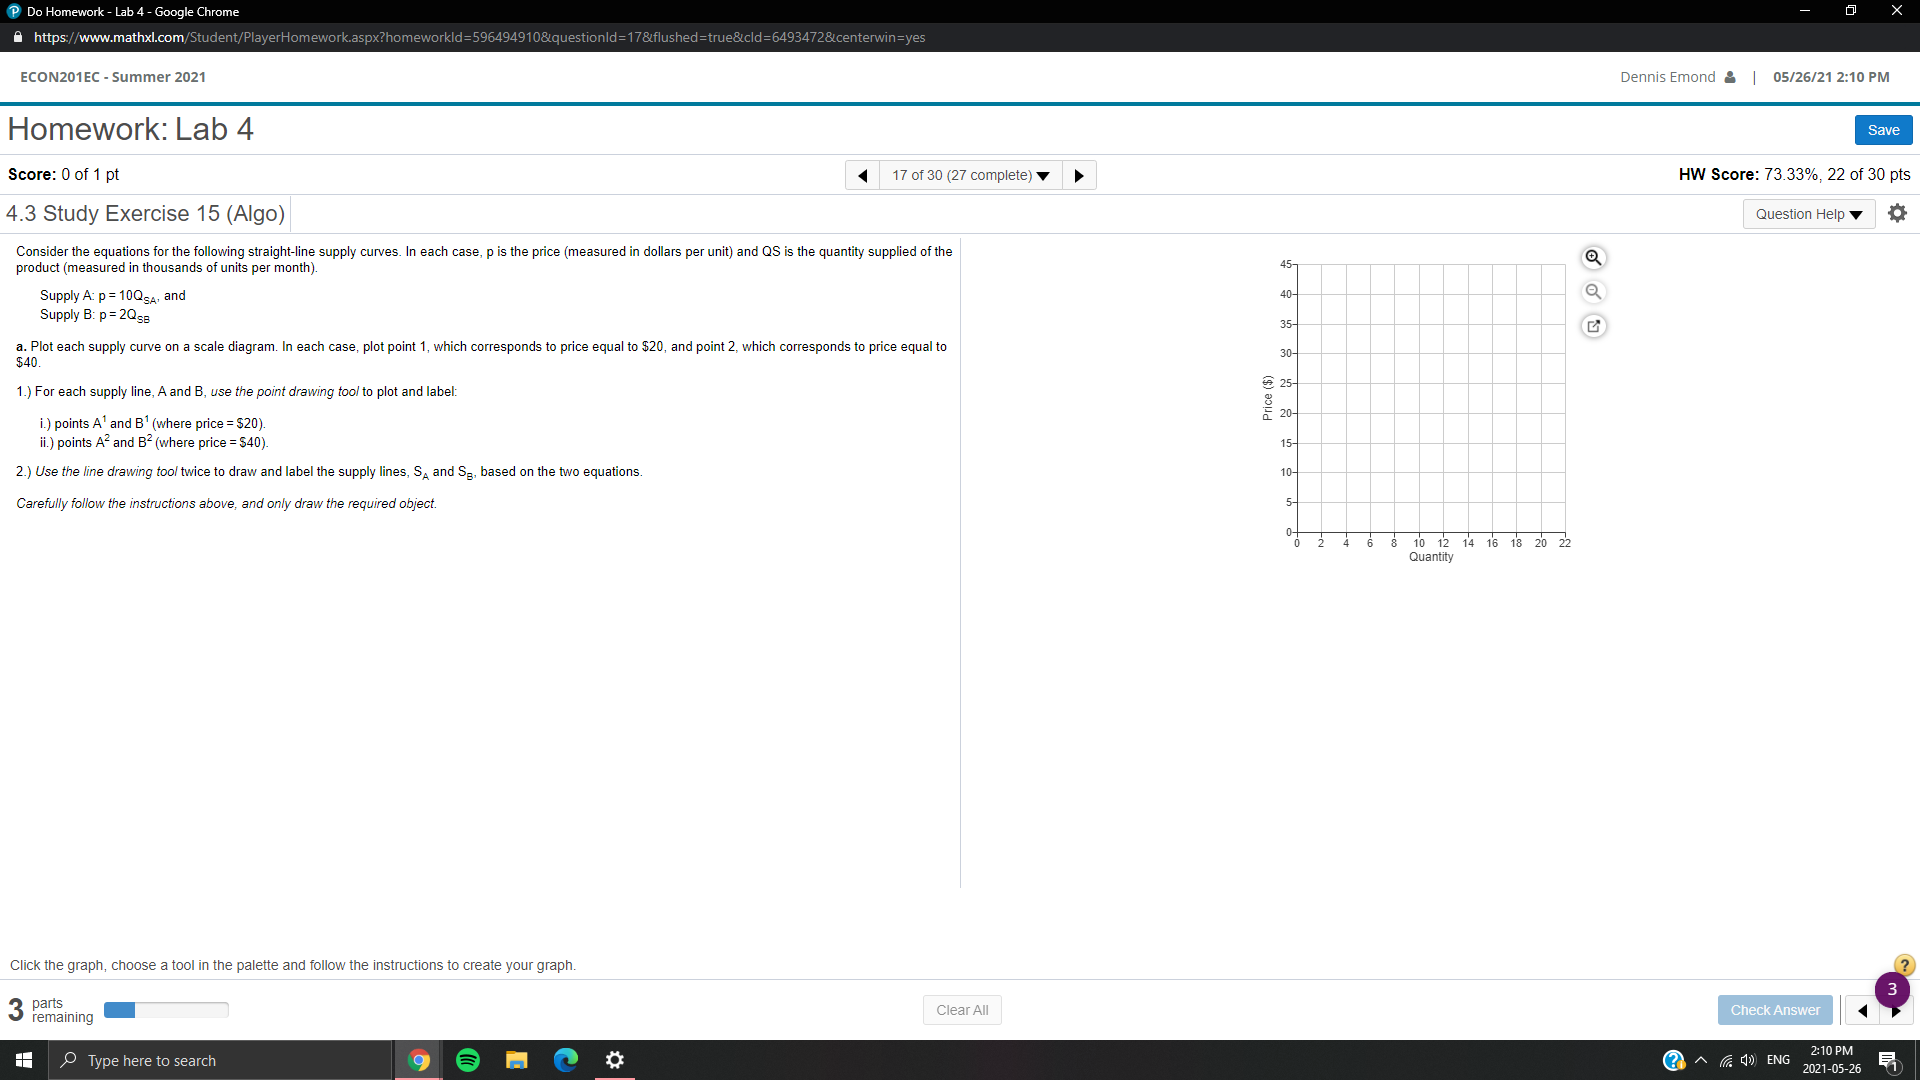
Do Homework - Lab 4 - Google Chrome https://www.mathxl.com/Student/PlayerHomework.aspx?homeworkld=596494910&questionld=17&flushed=true&cld=64934728centerwin=yes ECON201EC - Summer 2021 Dennis Emond & | 05/26/21 2:10 PM Homework: Lab 4 Save Score: 0 of 1 pt 17 of 30 (27 complete) HW Score: 73.33%, 22 of 30 pts 4.3 Study Exercise 15 (Algo) Question Help Consider the equations for the following straight-line supply curves. In each case, p is the price (measured in dollars per unit) and QS is the quantity supplied of the product (measured in thousands of units per month). Q Supply A: p = 10@SA, and Supply B: p = 20SB Q a. Plot each supply curve on a scale diagram. In each case, plot point 1, which corresponds to price equal to $20, and point 2, which corresponds to price equal to $40 1.) For each supply line, A and B, use the point drawing tool to plot and label: 25- Price ($) 20- i.) points A' and B' (where price = $20) i.) points A" and B (where price = $40) 15- 2.) Use the line drawing tool twice to draw and label the supply lines, SA and S, based on the two equations. Carefully follow the instructions above, and only draw the required object. of 6 8 10 12 14 16 18 20 22 Quantity Click the graph, choose a tool in the palette and follow the instructions to create your graph. 3 parts remaining Clear All Check Answer Type here to search 9 ?~ ) ENG 2:10 PM 2021-05-26
Step by Step Solution
There are 3 Steps involved in it

Get step-by-step solutions from verified subject matter experts