

Question: Hello, hope all is well. Please I need your help with a project, specifically questions 2 below. I'm going to attach below a screenshot of
Hello, hope all is well. Please I need your help with a project, specifically questions 2 below.
I'm going to attach below a screenshot of the data needed to solve the questions
Context for project : As a team of consultants, you are tasked with analyzing 25 American depository institutions in order to better understand their characteristics. A depository institution is a bank, or institution that holds securities and assists in the trading of securities. A depository institution provides security and liquidity in the market, uses money deposited for safekeeping to lend to others, invests in other securities, and offers a funds transfer system. A depository must return the deposit in the same condition upon request.
Question 2:
a)Using the data in columns B, C, and D calculated the weighted-average total equity and assets per state. (please show numbers)
b) Do you observe anything of significance that would be worth further investigation?
c) Construct a Box-and-Whisker plot to determine if there are extreme outliers in the data for columns
C and D. Use 3IQR in your whisker calculations. (Please show box-and-whiskey plot and calculations)
Here's the data, screenshot might be to small, so here's a link to this excel sheet :
https://docs.google.com/spreadsheets/d/163Mgd14jtmmw9rbXFBZX07sH5iH8lQAt/edit?usp=share_link&ouid=115422576723711698035&rtpof=true&sd=tru
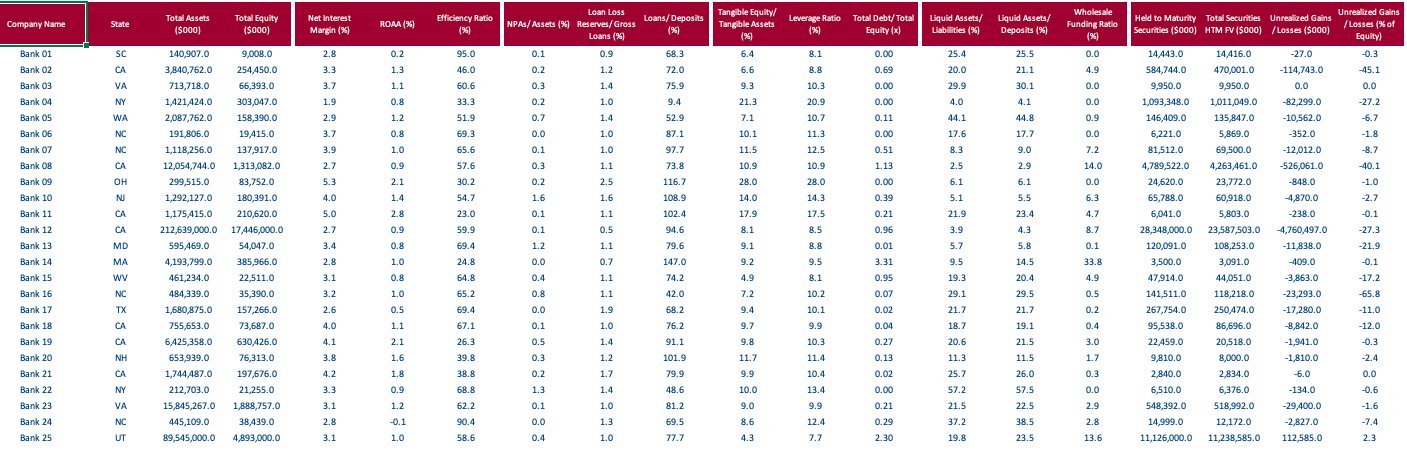
Wholesale Unrealized Gains Loan Loss Tangible Equity/ Liquid Assets/ Loans/ Deposits Leverage Ratio Total Debt/ Total Liquid Assets/ Held to Maturity Total Securities Unrealized Gains Funding Ratio / Losses (% of Total Assets Total Equity Net Interest Efficiency Ratio Securities ($000] HTM FV ($000) / Losses ($000) State RDAA (9%) NPAs/ Assets (9%) Reserves/ Gross Tangible Assets (9%) (99) Equity (x) Liabilities (9%) Deposits (9%] Company Name (95) Equity) ($000) ($000) Margin (9%) Loans (9%) (9%) 0.00 25.4 25.5 0.0 14,443.0 14,416.0 27.0 0.3 0.2 15.0 0.1 D.S 68.3 6.4 8.1 SC 140,907.0 9,008.0 2.8 4.9 584,744.0 470,001.0 -114,743.0 -45.1 Bank 01 21.1 3.3 13 46.0 0.2 1.2 72.0 6.6 8.8 0.69 20.0 Bank 02 CA 3,840,762.0 254,450.0 0.00 29.9 30.1 0.0 9,950.0 9,950.0 0.0 0.0 60.6 0.3 1.4 75.9 9.3 10.3 Bank 03 VA 713,718.0 66,393.0 3.7 1.1 21.3 20.9 0.00 4.0 4.1 0.0 1,093,348.0 1,011,049.0 82,299.0 -27.2 303,047.0 1.9 0.8 33.3 0.2 1.0 9.4 Bank 04 NY 1,421,424.0 146,409.0 135,847.0 -10,562.0 -6.7 1.2 51.9 0.7 1.4 52.9 7.1 10.7 0.11 44.1 44.8 0.9 Bank 05 WA 2,087,762.0 158,390.0 2.9 17.6 17.7 0.0 6,221.0 5,869.0 -352.0 -1.8 3.7 0.8 69.3 0.0 1.0 87.1 10.1 11.3 0.00 Bank 06 NC 191,806.0 19,415.0 9.0 7.2 81,512.0 69,500.0 -12,012.0 -8.7 3.9 10 65.6 0.1 1.0 97. 11.5 12.5 0.51 8.3 Bank 07 NC 1,118,256.0 137,917.0 14.0 4,789,522.0 4,263,461.0 -526,061.0 -40.1 73. 10.9 10.9 1.13 2.5 2.9 Bank 08 CA 12,054,744.0 1,313,082.0 2.7 0.9 57.6 0.3 1.1 23,772.0 848.0 -1.0 5.3 2.1 30.2 0.2 2.5 116.7 28.0 28.0 0.00 6.1 6.1 0.0 24,620.0 Bank 09 OH 299,515.0 83,752.0 6.3 65,788.0 60,918.0 4,870.0 -2.7 1.4 54.7 1.6 1.6 108.9 14.0 14.3 0.39 5.1 5.5 Bank 10 1,292,127.0 180,391.0 4.0 0.21 21.9 23.4 4.7 6,041.0 5,803.0 238.0 -0.1 102.4 17.9 17.5 Bank 11 CA 1,175,415.0 210,620.0 5.0 2.8 23.0 0.1 1.1 3.9 4.3 8.7 28,348,000.0 23,587,503.0 4,760,497.0 -27.3 8.5 0.96 Bank 12 CA 212,639,000.0 17 446,000.0 2.7 0.9 59.9 0.1 0.5 94.6 8.1 9.1 5.8 108,253.0 -11,838.0 8.8 0.01 5.7 0.1 120,091.0 -21.9 79.6 Bank 13 MD 595,469.0 54,047.0 3.4 0.8 69.4 1.2 1.1 3,091.0 409.0 -0.1 0.0 0.7 147.0 9.2 9.5 3.31 9.5 14.5 33.8 3,500.0 24.8 -17.2 Bank 14 MA 4,193,799.0 385,966.0 2.8 1.0 44,051.0 -3,863.0 8.1 0.95 19.3 20.4 4.9 47,914.0 wv 461,234.0 22,511.0 3.1 0.8 64.8 0.4 1.1 74.2 4.9 -65.8 Bank 15 -23,293.0 10.2 0.07 29.1 29.5 0.5 141,511.0 118,218.0 NC 484,339.0 35,390.0 3.2 1.0 65.2 0.8 1.1 12.0 7.2 10.1 0.02 21.7 267,754.0 -11.0 Bank 16 -17,280.0 9.4 21.7 0.2 250,474.0 Bank 17 TX 1,680,875.0 157,266.0 2.6 0.5 69.4 0.0 1.9 68.2 -12.0 0.1 1.0 76.2 9.7 9.9 0.04 18.7 19.1 0.4 95,538.0 86,696.0 -8,842.0 CA 755,653.0 73,687.0 1.1 Bank 18 4.0 67.1 22,459.0 20,518.0 1,941.0 -0.3 0.5 1.4 91.1 9.8 10.3 0.27 20.6 21.5 3.0 Bank 19 CA 6,425,358.0 630,426.0 4.1 2.1 26.3 11.4 0.13 11.3 11.5 1.7 9,810.0 8,000.0 1,810.0 -2.4 1.2 101.9 NH 653,939.0 3.8 39.8 11.7 Bank 20 76,313.0 1.6 0.3 0.3 2,840.0 2,834.0 -6.0 0.0 197,676.0 4.2 1.8 38.8 0.2 1.7 79.9 9.9 10.4 0.02 25.7 26.0 Bank 21 CA 1,744,487.0 57. 0.0 6,510.0 6,376.0 -134.0 -0.6 13.4 0.00 57.5 NY 212,703.0 21,255.0 3.3 0.9 68.8 1.3 1.4 48.6 10.0 2.9 548,392.0 518,992.0 -29,400.0 -1.6 Bank 22 9.9 0.21 21.5 22.5 VA 15,845,267.0 1,888,757.0 3.1 1.2 62.2 0.1 1.0 81.2 9.0 -7.4 Bank 23 0.29 37.2 38.5 2.8 14,999.0 12,172.0 -2,827.0 NC 445,109.0 38,439.0 2.8 -0.1 90.4 0.0 1.3 69.5 8.6 12.4 Bank 24 1.0 77.7 4.3 7.7 2.30 19.8 23.5 13.6 11,126,000.0 11,238,585.0 112,585.0 2.3 0.4 89,545,000.0 4,893,000.0 3.1 58.6 Bank 25 UT
Step by Step Solution
There are 3 Steps involved in it

Get step-by-step solutions from verified subject matter experts