Question: Hello, I am a bit stuck on my assignment this week. I believe I have figured out steps 1-3. I am a bit stuck on
Hello,
I am a bit stuck on my assignment this week. I believe I have figured out steps 1-3. I am a bit stuck on 4-6. Any help would be appreciated.
"
This notebook contains the step-by-step directions for Project Two. It is very important to run through the steps in order. Some steps depend on the outputs of earlier steps. Once you have completed the steps in this notebook, be sure to write your summary report.
You are a data analyst for a basketball team and have access to a large set of historical data that you can use to analyze performance patterns. The coach of the team and your management have requested that you perform several hypothesis tests to statistically validate claims about your team's performance. This analysis will provide evidence for these claims and help make key decisions to improve the performance of the team. You will use the Python programming language to perform the statistical analyses and then prepare a report of your findings for the teams management. Since the managers are not data analysts, you will need to interpret your findings and describe their practical implications.
There are four important variables in the data set that you will study in Project Two."
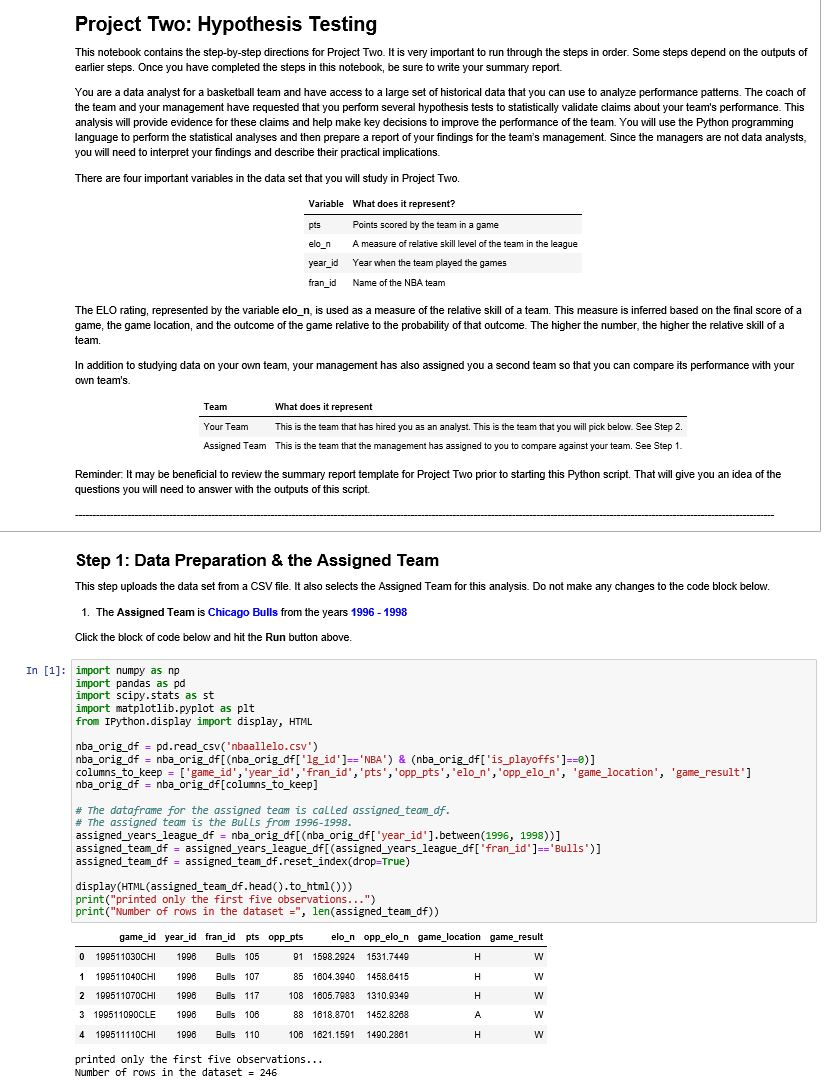
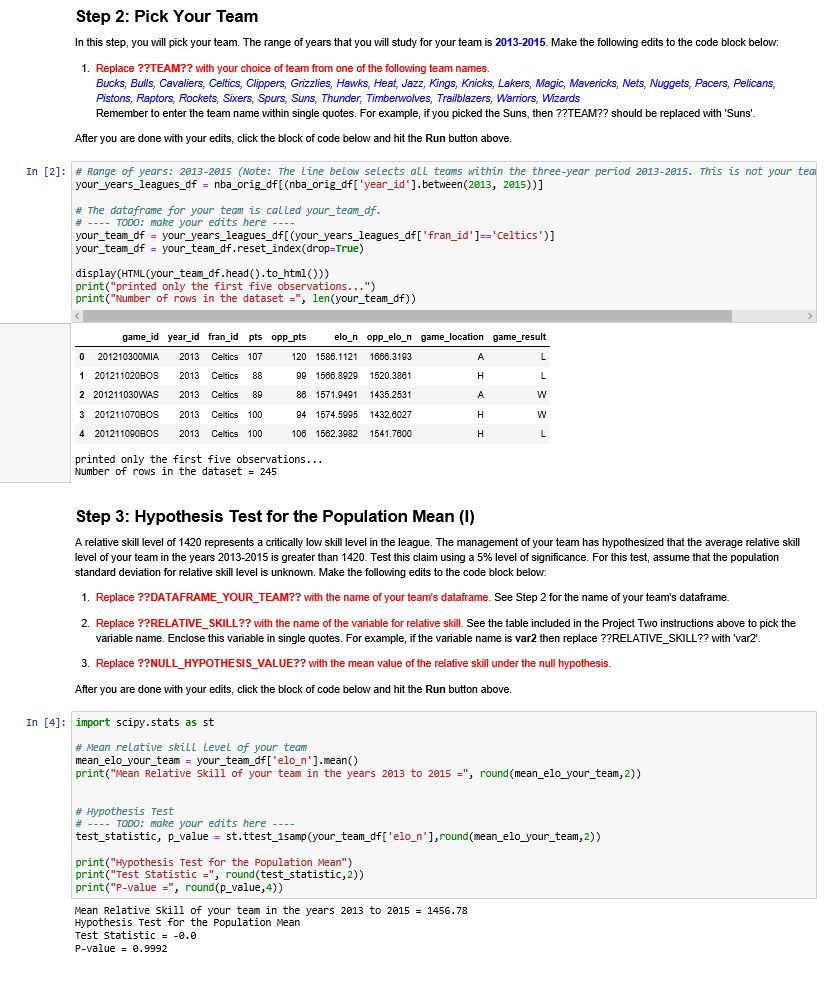
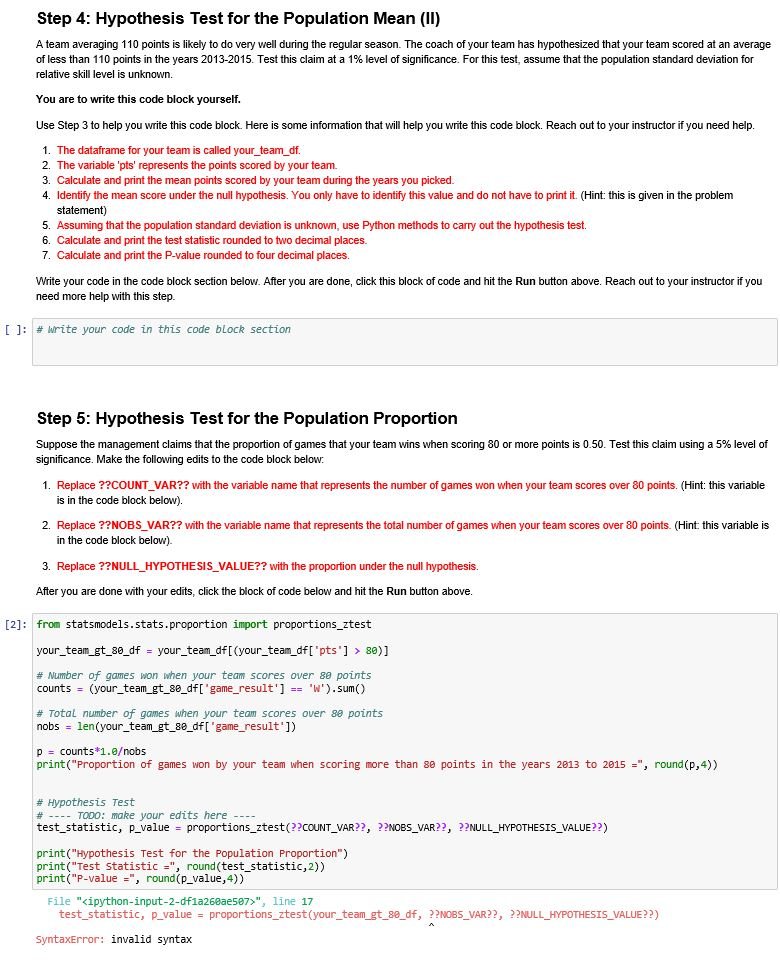
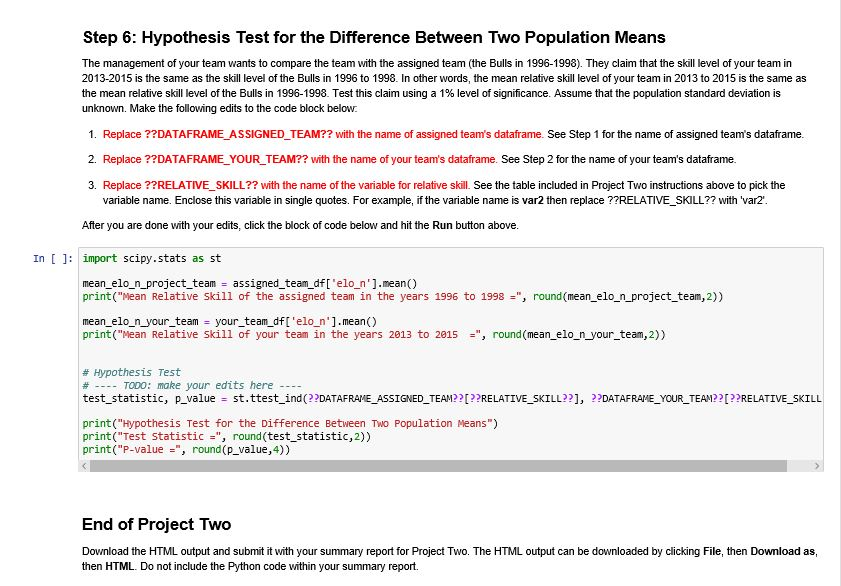
Project Two: Hypothesis Testing This notebook contains the step-by-step directions for Project Two. It is very important to run through the steps in order. Some steps depend on the outputs of earlier steps. Once you have completed the steps in this notebook, be sure to write your summary report. You are a data analyst for a basketball team and have access to a large set of historical data that you can use to analyze performance patterns. The coach of the team and your management have requested that you perform several hypothesis tests to statistically validate claims about your team's performance. This analysis will provide evidence for these claims and help make key decisions to improve the performance of the team. You will use the Python programming language to perform the statistical analyses and then prepare a report of your findings for the team's management. Since the managers are not data analysts, you will need to interpret your findings and describe their practical implications There are four important variables in the data set that you will study in Project Two. Variable What does it represent? pts elo_n year_id Points scored by the team in a game A measure of relative skill level of the team in the league Year when the team played the games fran_id Name of the NBA team The ELO rating, represented by the variable elo_n, is used as a measure of the relative skill of a team. This measure is inferred based on the final score of a game, the game location, and the outcome of the game relative to the probability of that outcome. The higher the number, the higher the relative skill of a team. In addition to studying data on your own team, your management has also assigned you a second team so that you can compare its performance with your own team's. Team Your Team Assigned Team What does it represent T his is the team that has hired you as an analyst. This is the team that you will pick below. See Step 2. This is the team that the management has assigned to you to compare against your team. See Step 1 Reminder. It may be beneficial to review the summary report template for Project Two prior to starting this Python script. That will give you an idea of the questions you will need to answer with the outputs of this script. Step 1: Data Preparation & the Assigned Team This step uploads the data set from a CSV file. It also selects the Assigned Team for this analysis. Do not make any changes to the code block below. 1. The Assigned Team is Chicago Bulls from the years 1996 - 1998 Click the block of code below and hit the Run button above. In [1]; import numpy as np import pandas as pd import scipy.stats as st import matplotlib.pyplot as plt from IPython.display import display, HTML nba_orig_df = pd.read_csv('nbaallelo.csv') nba_orig_df = nba_orig_df[(nba_orig_df['1g_id']='NBA') & (nba_orig_df["is_playoffs']==0)] columns_to_keep = ['game_id', 'year_id', 'fran_id', 'pts','opp_pts', 'elo_n','opp_elon', 'game_location', 'game_result'] nba_orig_df = nba_orig_df [columns_to_keep] # The dataframe for the assigned team is called assigned team_df. # The assigned team is the Bulls from 1996-1998. assigned_years_league_df = nba_orig_df[(nba_orig_df['year id'].between(1996, 1998) assigned_team_df = assigned_years_league_df[(assigned_years_league_df['fran_id')=='Bulls')] assigned_team_df = assigned_team_df.reset_index(drop=True) display (HTML (assigned_team_df.head().to_html())) print("printed only the first five observations...") print("Number of rows in the dataset =", len(assigned team df)) game_location game_result game_id year_id fran_id pts opp_pts elo_n opp_elo_n 0 199511030CHI 1998 Bulls 105 01 1508.2924 1531.7449 1 199511040CHI 1998 Bulls 107 85 1604.3940 1458.6415 2 199511070CHI 1998 Bulls 117 108 1805.7983 1310.9349 3 199511090CLE 1996 Bulls 106 88 1618.8701 1452.8288 4 199511110CHI 1998 Bulls 110 106 1621.1591 1490.2861 III I printed only the first five observations... Number of rows in the dataset = 246 Step 2: Pick Your Team In this step, you will pick your team. The range of years that you will study for your team is 2013-2015. Make the following edits to the code block below: 1. Replace ??TEAM?? with your choice of team from one of the following team names. Bucks, Bulls, Cavaliers. Celtics, Clippers, Grizzlies, Hawks, Heat, Jazz, Kings, Knicks, Lakers, Magic, Mavericks, Nets, Nuggets. Pacers, Pelicans, Pistons, Raptors, Rockets, Sixers, Spurs, Suns, Thunder, Timberwolves, Trailblazers, Warriors, Wizards Remember to enter the team name within single quotes. For example, if you picked the Suns, then ??TEAM?? should be replaced with 'Suns' After you are done with your edits, click the block of code below and hit the Run button above. In [2]: # Range of years: 2013-2015 (Note: The Line below selects all teams within the three-year period 2013-2015. This is not your tea your_years_leagues_df = nba_orig_df[(nba_orig_df [ 'year_id"]. between(2013, 2015))] # The dataframe for your team is called your_team_df. # ---- TODO: make your edits here -- your_team_df = your_years_leagues_df[(your_years_leagues_df['fran_id']='Celtics')] your_team_df = your_team_df.reset_index(drop=True) display (HTML(your_team_df.head().to_html()) print("printed only the first five observations...") print("Number of rows in the dataset =", len(your_team_df)) game_location game_result - - game_id year_id fran_id 0 201210300MIA 2013 Celtics 1 201211020BOS 2013 Celtics 2 201211030WAS 2013 Celtics 3 201211070BOS 2013 Celtics 4201211090BOS 2013 Celtics pts opp_pts elo_n opp_elo_n 107 120 1586.1121 1666.3193 88 99 1586.8929 1520.3861 89 88 1571.9491 1435.2531 100 94 1574.5995 1432.6027 100 106 1562.3982 1541.7600 printed only the first five observations... Number of rows in the dataset = 245 Step 3: Hypothesis Test for the population Mean (1) A relative skill level of 1420 represents a critically low skill level in the league. The management of your team has hypothesized that the average relative skill level of your team in the years 2013-2015 is greater than 1420. Test this claim using a 5% level of significance. For this test, assume that the population standard deviation for relative skill level is unknown. Make the following edits to the code block below: 1. Replace ??DATAFRAME YOUR TEAM?? with the name of your team's dataframe. See Step 2 for the name of your team's dataframe. 2. Replace ??RELATIVE_SKILL?? with the name of the variable for relative skill. See the table included in the Project Two instructions above to pick the variable name. Enclose this variable in single quotes. For example, if the variable name is var2 then replace ??RELATIVE SKILL?? with 'var2. 3. Replace ??NULL HYPOTHESIS_VALUE?? with the mean value of the relative skill under the null hypothesis. After you are done with your edits, click the block of code below and hit the Run button above. In [4]: import scipy.stats as st # Mean relative skill Level of your team mean_elo_your_team = your_team_df['elo_n'].mean() print("Mean Relative Skill of your team in the years 2013 to 2015 =", round (mean_elo_your_team,2)) # Hypothesis Test # ---- TODO: make your edits here ---- test_statistic, p_value = st.ttest_1samp (your_team_df['elo_n'], round(mean_elo_your_team, 2)) print("Hypothesis Test for the population Mean") print("Test Statistic = ", round(test_statistic,2)) print("P-value=", round(p_value, 4)) Mean Relative Skill of your team in the years 2013 to 2015 - 1456.78 Hypothesis Test for the population Mean Test statistic = -0.0 P-value = 0.9992 Step 4: Hypothesis Test for the population Mean (II) A team averaging 110 points is likely to do very well during the regular season. The coach of your team has hypothesized that your team scored at an average of less than 110 points in the years 2013-2015. Test this claim at a 1% level of significance. For this test, assume that the population standard deviation for relative skill level is unknown. You are to write this code block yourself. Use Step 3 to help you write this code block. Here is some information that will help you write this code block. Reach out to your instructor if you need help. 1. The dataframe for your team is called your_team_df. 2. The variable 'pts' represents the points scored by your team. 3. Calculate and print the mean points scored by your team during the years you picked. 4. Identify the mean score under the null hypothesis. You only have to identify this value and do not have to print it. (Hint: this is given in the problem statement) 5. Assuming that the population standard deviation is unknown, use Python methods to carry out the hypothesis test. 6. Calculate and print the test statistic rounded to two decimal places 7. Calculate and print the P-value rounded to four decimal places. Write your code in the code block section below. After you are done, click this block of code and hit the Run button above. Reach out to your instructor if you need more help with this step. [ ]: # write your code in this code block section Step 5: Hypothesis Test for the Population Proportion Suppose the management claims that the proportion of games that your team wins when scoring 80 or more points is 0.50. Test this claim using a 5% level of significance. Make the following edits to the code block below: 1. Replace ??COUNT VAR?? with the variable name that represents the number of games won when your team scores over 80 points. (Hint: this variable is in the code block below). 2. Replace ??NOBS VAR?? with the variable name that represents the total number of games when your team scores over 80 points. (Hint: this variable is in the code block below) 3. Replace ??NULL_HYPOTHESIS_VALUE?? with the proportion under the null hypothesis. After you are done with your edits, click the block of code below and hit the Run button above. [2]: from statsmodels.stats.proportion import proportions_ztest your_team_gt_80_df = your_team_df[(your_team_df['pts'] > 80)] # Number of games won when your team scores over 80 points counts = (your_team_gt_80_df['game_result'] == 'W').sum() # Total number of games when your team scores over se points nobs = len(your_team_gt_80_df['game_result']) p = counts*1.0obs print("Proportion of games won by your team when scoring more than 80 points in the years 2013 to 2015 -", round(p,4)) # Hypothesis Test # ---- TODO: make your edits here ---- test_statistic, p_value - proportions_ztest(??COUNT_VAR??, ??NOBS_VAR??, ??NULL_HYPOTHESIS_VALUE??) print("Hypothesis Test for the population Proportion") print("Test Statistic=", round(test_statistic,2)) print("P-value =", round(P_value, 4)) File "", line 17 test_statistic, p_value = proportions_ztest(your_team_gt_80_df, ??NOBS_VAR??, ??NULL_HYPOTHESIS_VALUE??) SyntaxError: invalid syntax Step 6: Hypothesis Test for the Difference Between Two Population Means The management of your team wants to compare the team with the assigned team (the Bulls in 1996-1998). They claim that the skill level of your team in 2013-2015 is the same as the skill level of the Bulls in 1996 to 1998. In other words, the mean relative skill level of your team in 2013 to 2015 is the same as the mean relative skill level of the Bulls in 1996-1998. Test this claim using a 1% level of significance. Assume that the population standard deviation is unknown. Make the following edits to the code block below. 1. Replace ??DATAFRAME ASSIGNED TEAM?? with the name of assigned team's dataframe. See Step 1 for the name of assigned team's dataframe 2. Replace ??DATAFRAME YOUR TEAM?? with the name of your team's dataframe. See Step 2 for the name of your team's dataframe. 3. Replace ??RELATIVE SKILL?? with the name of the variable for relative skill. See the table included in Project Two instructions above to pick the variable name. Enclose this variable in single quotes. For example, if the variable name is var2 then replace ??RELATIVE_SKILL?? with 'var2". After you are done with your edits, click the block of code below and hit the Run button above. In [ ]: import scipy.stats as st mean_elo_n_project_team = assigned_team_df['elo_n'].mean() print("Mean Relative skill of the assigned team in the years 1996 to 1998=", round (mean_elo_n_project_team, 2)) mean_elo_n_your_team = your_team_df['elo_n'].mean() print("Mean Relative Skill of your team in the years 2013 to 2015 +", round(mean_elo_n_your_team,2)) # Hypothesis Test # ---- TODO: make your edits here --- test_statistic, p_value = st.ttest_ind(??DATAFRAME_ASSIGNED_TEAM??[??RELATIVE_SKILL??], ??DATAFRAME_YOUR_TEAM??[??RELATIVE_SKILL print("Hypothesis Test for the Difference Between Two Population Means") print("Test Statistic =", round(test_statistic,2)) print("P-value=", round(p_value, 4)) End of Project Two Download the HTML output and submit it with your summary report for Project Two. The HTML output can be downloaded by clicking File, then Download as, then HTML. Do not include the Python code within your summary report. Project Two: Hypothesis Testing This notebook contains the step-by-step directions for Project Two. It is very important to run through the steps in order. Some steps depend on the outputs of earlier steps. Once you have completed the steps in this notebook, be sure to write your summary report. You are a data analyst for a basketball team and have access to a large set of historical data that you can use to analyze performance patterns. The coach of the team and your management have requested that you perform several hypothesis tests to statistically validate claims about your team's performance. This analysis will provide evidence for these claims and help make key decisions to improve the performance of the team. You will use the Python programming language to perform the statistical analyses and then prepare a report of your findings for the team's management. Since the managers are not data analysts, you will need to interpret your findings and describe their practical implications There are four important variables in the data set that you will study in Project Two. Variable What does it represent? pts elo_n year_id Points scored by the team in a game A measure of relative skill level of the team in the league Year when the team played the games fran_id Name of the NBA team The ELO rating, represented by the variable elo_n, is used as a measure of the relative skill of a team. This measure is inferred based on the final score of a game, the game location, and the outcome of the game relative to the probability of that outcome. The higher the number, the higher the relative skill of a team. In addition to studying data on your own team, your management has also assigned you a second team so that you can compare its performance with your own team's. Team Your Team Assigned Team What does it represent T his is the team that has hired you as an analyst. This is the team that you will pick below. See Step 2. This is the team that the management has assigned to you to compare against your team. See Step 1 Reminder. It may be beneficial to review the summary report template for Project Two prior to starting this Python script. That will give you an idea of the questions you will need to answer with the outputs of this script. Step 1: Data Preparation & the Assigned Team This step uploads the data set from a CSV file. It also selects the Assigned Team for this analysis. Do not make any changes to the code block below. 1. The Assigned Team is Chicago Bulls from the years 1996 - 1998 Click the block of code below and hit the Run button above. In [1]; import numpy as np import pandas as pd import scipy.stats as st import matplotlib.pyplot as plt from IPython.display import display, HTML nba_orig_df = pd.read_csv('nbaallelo.csv') nba_orig_df = nba_orig_df[(nba_orig_df['1g_id']='NBA') & (nba_orig_df["is_playoffs']==0)] columns_to_keep = ['game_id', 'year_id', 'fran_id', 'pts','opp_pts', 'elo_n','opp_elon', 'game_location', 'game_result'] nba_orig_df = nba_orig_df [columns_to_keep] # The dataframe for the assigned team is called assigned team_df. # The assigned team is the Bulls from 1996-1998. assigned_years_league_df = nba_orig_df[(nba_orig_df['year id'].between(1996, 1998) assigned_team_df = assigned_years_league_df[(assigned_years_league_df['fran_id')=='Bulls')] assigned_team_df = assigned_team_df.reset_index(drop=True) display (HTML (assigned_team_df.head().to_html())) print("printed only the first five observations...") print("Number of rows in the dataset =", len(assigned team df)) game_location game_result game_id year_id fran_id pts opp_pts elo_n opp_elo_n 0 199511030CHI 1998 Bulls 105 01 1508.2924 1531.7449 1 199511040CHI 1998 Bulls 107 85 1604.3940 1458.6415 2 199511070CHI 1998 Bulls 117 108 1805.7983 1310.9349 3 199511090CLE 1996 Bulls 106 88 1618.8701 1452.8288 4 199511110CHI 1998 Bulls 110 106 1621.1591 1490.2861 III I printed only the first five observations... Number of rows in the dataset = 246 Step 2: Pick Your Team In this step, you will pick your team. The range of years that you will study for your team is 2013-2015. Make the following edits to the code block below: 1. Replace ??TEAM?? with your choice of team from one of the following team names. Bucks, Bulls, Cavaliers. Celtics, Clippers, Grizzlies, Hawks, Heat, Jazz, Kings, Knicks, Lakers, Magic, Mavericks, Nets, Nuggets. Pacers, Pelicans, Pistons, Raptors, Rockets, Sixers, Spurs, Suns, Thunder, Timberwolves, Trailblazers, Warriors, Wizards Remember to enter the team name within single quotes. For example, if you picked the Suns, then ??TEAM?? should be replaced with 'Suns' After you are done with your edits, click the block of code below and hit the Run button above. In [2]: # Range of years: 2013-2015 (Note: The Line below selects all teams within the three-year period 2013-2015. This is not your tea your_years_leagues_df = nba_orig_df[(nba_orig_df [ 'year_id"]. between(2013, 2015))] # The dataframe for your team is called your_team_df. # ---- TODO: make your edits here -- your_team_df = your_years_leagues_df[(your_years_leagues_df['fran_id']='Celtics')] your_team_df = your_team_df.reset_index(drop=True) display (HTML(your_team_df.head().to_html()) print("printed only the first five observations...") print("Number of rows in the dataset =", len(your_team_df)) game_location game_result - - game_id year_id fran_id 0 201210300MIA 2013 Celtics 1 201211020BOS 2013 Celtics 2 201211030WAS 2013 Celtics 3 201211070BOS 2013 Celtics 4201211090BOS 2013 Celtics pts opp_pts elo_n opp_elo_n 107 120 1586.1121 1666.3193 88 99 1586.8929 1520.3861 89 88 1571.9491 1435.2531 100 94 1574.5995 1432.6027 100 106 1562.3982 1541.7600 printed only the first five observations... Number of rows in the dataset = 245 Step 3: Hypothesis Test for the population Mean (1) A relative skill level of 1420 represents a critically low skill level in the league. The management of your team has hypothesized that the average relative skill level of your team in the years 2013-2015 is greater than 1420. Test this claim using a 5% level of significance. For this test, assume that the population standard deviation for relative skill level is unknown. Make the following edits to the code block below: 1. Replace ??DATAFRAME YOUR TEAM?? with the name of your team's dataframe. See Step 2 for the name of your team's dataframe. 2. Replace ??RELATIVE_SKILL?? with the name of the variable for relative skill. See the table included in the Project Two instructions above to pick the variable name. Enclose this variable in single quotes. For example, if the variable name is var2 then replace ??RELATIVE SKILL?? with 'var2. 3. Replace ??NULL HYPOTHESIS_VALUE?? with the mean value of the relative skill under the null hypothesis. After you are done with your edits, click the block of code below and hit the Run button above. In [4]: import scipy.stats as st # Mean relative skill Level of your team mean_elo_your_team = your_team_df['elo_n'].mean() print("Mean Relative Skill of your team in the years 2013 to 2015 =", round (mean_elo_your_team,2)) # Hypothesis Test # ---- TODO: make your edits here ---- test_statistic, p_value = st.ttest_1samp (your_team_df['elo_n'], round(mean_elo_your_team, 2)) print("Hypothesis Test for the population Mean") print("Test Statistic = ", round(test_statistic,2)) print("P-value=", round(p_value, 4)) Mean Relative Skill of your team in the years 2013 to 2015 - 1456.78 Hypothesis Test for the population Mean Test statistic = -0.0 P-value = 0.9992 Step 4: Hypothesis Test for the population Mean (II) A team averaging 110 points is likely to do very well during the regular season. The coach of your team has hypothesized that your team scored at an average of less than 110 points in the years 2013-2015. Test this claim at a 1% level of significance. For this test, assume that the population standard deviation for relative skill level is unknown. You are to write this code block yourself. Use Step 3 to help you write this code block. Here is some information that will help you write this code block. Reach out to your instructor if you need help. 1. The dataframe for your team is called your_team_df. 2. The variable 'pts' represents the points scored by your team. 3. Calculate and print the mean points scored by your team during the years you picked. 4. Identify the mean score under the null hypothesis. You only have to identify this value and do not have to print it. (Hint: this is given in the problem statement) 5. Assuming that the population standard deviation is unknown, use Python methods to carry out the hypothesis test. 6. Calculate and print the test statistic rounded to two decimal places 7. Calculate and print the P-value rounded to four decimal places. Write your code in the code block section below. After you are done, click this block of code and hit the Run button above. Reach out to your instructor if you need more help with this step. [ ]: # write your code in this code block section Step 5: Hypothesis Test for the Population Proportion Suppose the management claims that the proportion of games that your team wins when scoring 80 or more points is 0.50. Test this claim using a 5% level of significance. Make the following edits to the code block below: 1. Replace ??COUNT VAR?? with the variable name that represents the number of games won when your team scores over 80 points. (Hint: this variable is in the code block below). 2. Replace ??NOBS VAR?? with the variable name that represents the total number of games when your team scores over 80 points. (Hint: this variable is in the code block below) 3. Replace ??NULL_HYPOTHESIS_VALUE?? with the proportion under the null hypothesis. After you are done with your edits, click the block of code below and hit the Run button above. [2]: from statsmodels.stats.proportion import proportions_ztest your_team_gt_80_df = your_team_df[(your_team_df['pts'] > 80)] # Number of games won when your team scores over 80 points counts = (your_team_gt_80_df['game_result'] == 'W').sum() # Total number of games when your team scores over se points nobs = len(your_team_gt_80_df['game_result']) p = counts*1.0obs print("Proportion of games won by your team when scoring more than 80 points in the years 2013 to 2015 -", round(p,4)) # Hypothesis Test # ---- TODO: make your edits here ---- test_statistic, p_value - proportions_ztest(??COUNT_VAR??, ??NOBS_VAR??, ??NULL_HYPOTHESIS_VALUE??) print("Hypothesis Test for the population Proportion") print("Test Statistic=", round(test_statistic,2)) print("P-value =", round(P_value, 4)) File "", line 17 test_statistic, p_value = proportions_ztest(your_team_gt_80_df, ??NOBS_VAR??, ??NULL_HYPOTHESIS_VALUE??) SyntaxError: invalid syntax Step 6: Hypothesis Test for the Difference Between Two Population Means The management of your team wants to compare the team with the assigned team (the Bulls in 1996-1998). They claim that the skill level of your team in 2013-2015 is the same as the skill level of the Bulls in 1996 to 1998. In other words, the mean relative skill level of your team in 2013 to 2015 is the same as the mean relative skill level of the Bulls in 1996-1998. Test this claim using a 1% level of significance. Assume that the population standard deviation is unknown. Make the following edits to the code block below. 1. Replace ??DATAFRAME ASSIGNED TEAM?? with the name of assigned team's dataframe. See Step 1 for the name of assigned team's dataframe 2. Replace ??DATAFRAME YOUR TEAM?? with the name of your team's dataframe. See Step 2 for the name of your team's dataframe. 3. Replace ??RELATIVE SKILL?? with the name of the variable for relative skill. See the table included in Project Two instructions above to pick the variable name. Enclose this variable in single quotes. For example, if the variable name is var2 then replace ??RELATIVE_SKILL?? with 'var2". After you are done with your edits, click the block of code below and hit the Run button above. In [ ]: import scipy.stats as st mean_elo_n_project_team = assigned_team_df['elo_n'].mean() print("Mean Relative skill of the assigned team in the years 1996 to 1998=", round (mean_elo_n_project_team, 2)) mean_elo_n_your_team = your_team_df['elo_n'].mean() print("Mean Relative Skill of your team in the years 2013 to 2015 +", round(mean_elo_n_your_team,2)) # Hypothesis Test # ---- TODO: make your edits here --- test_statistic, p_value = st.ttest_ind(??DATAFRAME_ASSIGNED_TEAM??[??RELATIVE_SKILL??], ??DATAFRAME_YOUR_TEAM??[??RELATIVE_SKILL print("Hypothesis Test for the Difference Between Two Population Means") print("Test Statistic =", round(test_statistic,2)) print("P-value=", round(p_value, 4)) End of Project Two Download the HTML output and submit it with your summary report for Project Two. The HTML output can be downloaded by clicking File, then Download as, then HTML. Do not include the Python code within your summary report


