

Question: Hello! I am having some trouble getting the answer to this. The first picture here is the table that the question is referencing, then the
Hello! I am having some trouble getting the answer to this. The first picture here is the table that the question is referencing, then the rest is the question being asked. These are the only bits of information given to answer this question!
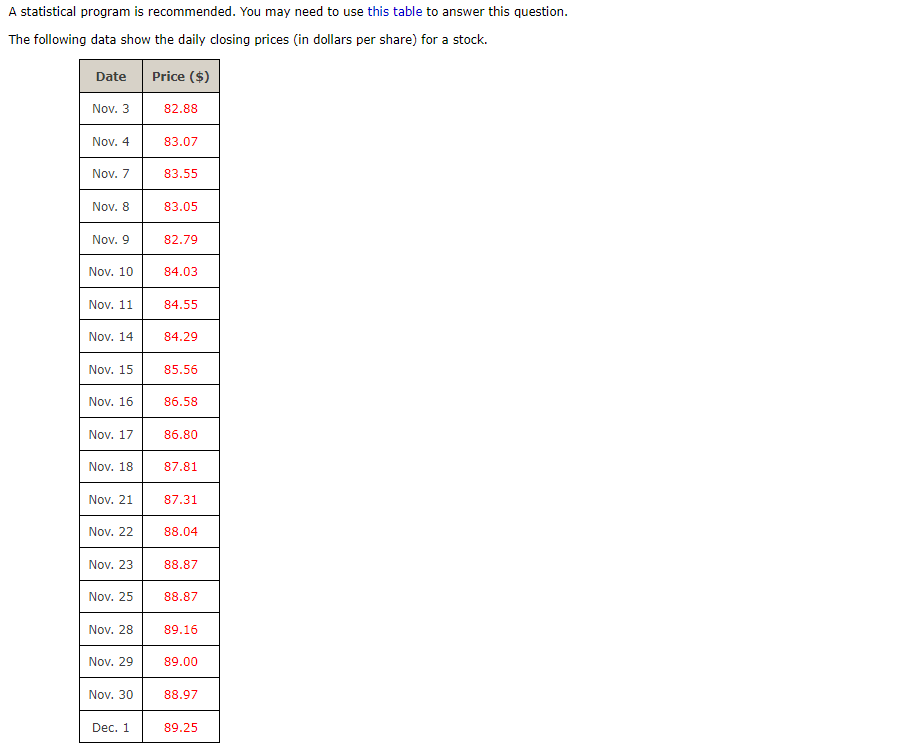

A statistical program is recommended. You may need to use this table to answer this question. The following data show the daily closing prices (in dollars per share) for a stock. Date Price ($) Nov. 3 82.88 Nov. 4 83.07 Nov. 7 83.55 Nov. 8 83.05 Nov. 9 82.79 Nov. 10 84.03 Nov. 11 84.55 Nov. 14 84.29 Nov. 15 85.56 Nov. 16 86.58 Nov. 17 86.80 Nov. 18 87.81 Nov. 21 87.31 Nov. 22 88.04 Nov. 23 88.87 Nov. 25 88.87 Nov. 28 89.16 Nov. 29 89.00 Nov. 30 88.97 Dec. 1 89.25
Step by Step Solution
There are 3 Steps involved in it

Get step-by-step solutions from verified subject matter experts