

Question: hello, I am having trouble deriving and graphing the marginal revenue curve, as well as questions b, c and d Safari File Edit View History
hello, I am having trouble deriving and graphing the marginal revenue curve, as well as questions b, c and d

![. . . [ laecon1.lyryx.com Question 3 [20 points] Suppose there is](https://s3.amazonaws.com/si.experts.images/answers/2024/06/6675c19145c73_2966675c190f009f.jpg)
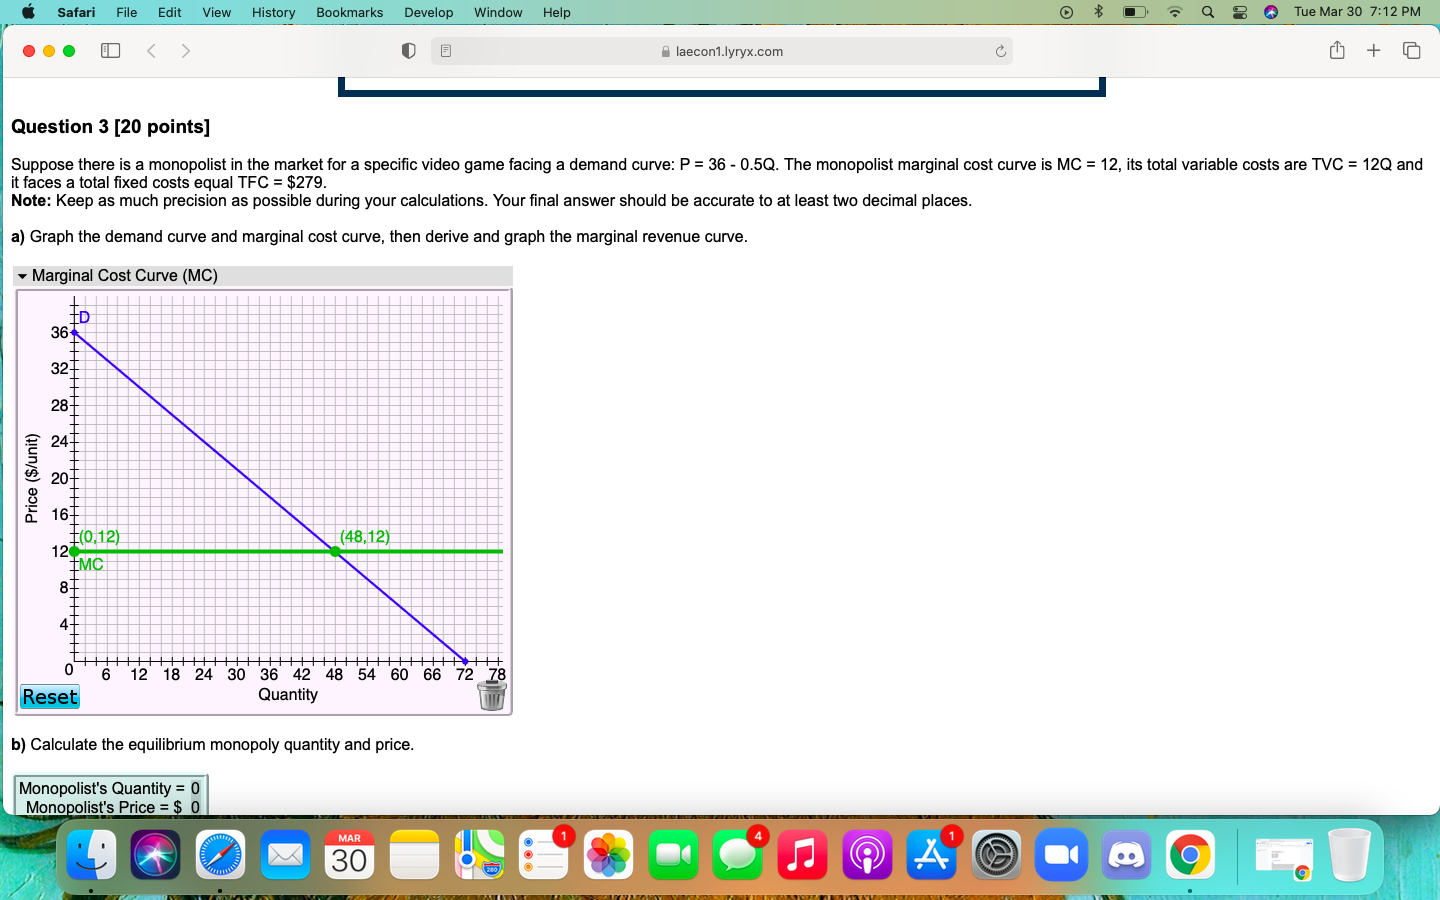
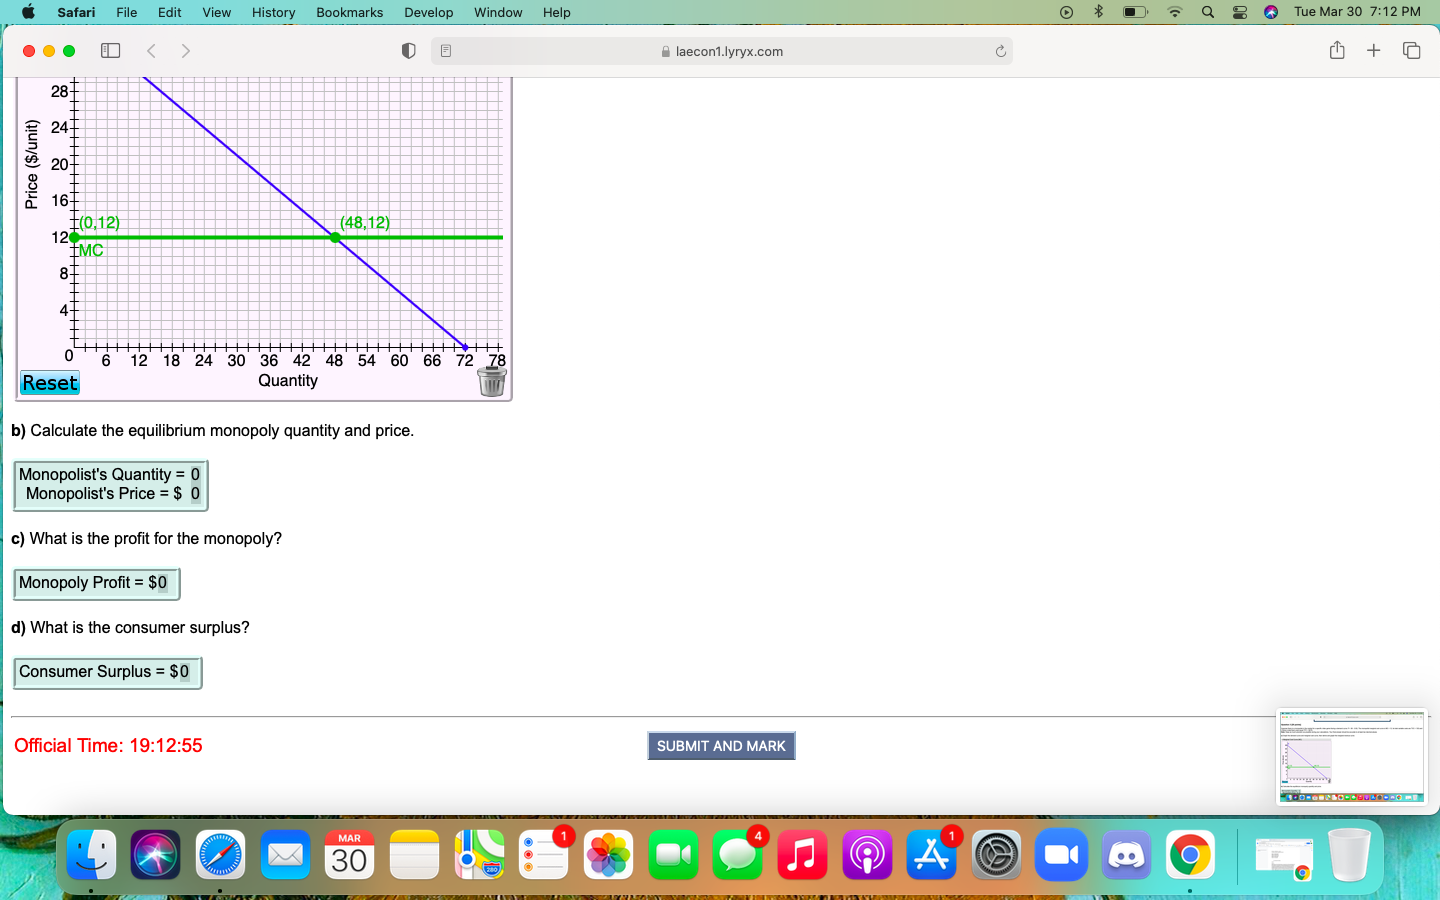
Safari File Edit View History Bookmarks Develop Window Help Q Tue Mar 30 7:12 PM . . . [ laecon1.lyryx.com Question 3 [20 points] Suppose there is a monopolist in the market for a specific video game facing a demand curve: P = 36 - 0.5Q. The monopolist marginal cost curve is MC = 12, its total variable costs are TVC = 12Q and it faces a total fixed costs equal TFC = $279. Note: Keep as much precision as possible during your calculations. Your final answer should be accurate to at least two decimal places. a) Graph the demand curve and marginal cost curve, then derive and graph the marginal revenue curve. Marginal Cost Curve (MC) 36 Price ($/unit) (0,12) (48,12) 1297 IMC CO 6 12 18 24 30 36 42 48 54 60 66 72 78 Reset Quantity b) Calculate the equilibrium monopoly quantity and price. Monopolist's Quantity = 0 Monopolist's Price = $ 0 MAR FSafari File Edit View History Bookmarks Develop Window Help Q 2 Tue Mar 30 7:12 PM ...
Step by Step Solution
There are 3 Steps involved in it

Get step-by-step solutions from verified subject matter experts