

Question: Hello I am needing help with calculating the Inventory Ratios and what to do on Q2 and so forth. AutoSave Inventory Analysis (Empty) Formulas Data
Hello I am needing help with calculating the Inventory Ratios and what to do on Q2 and so forth.
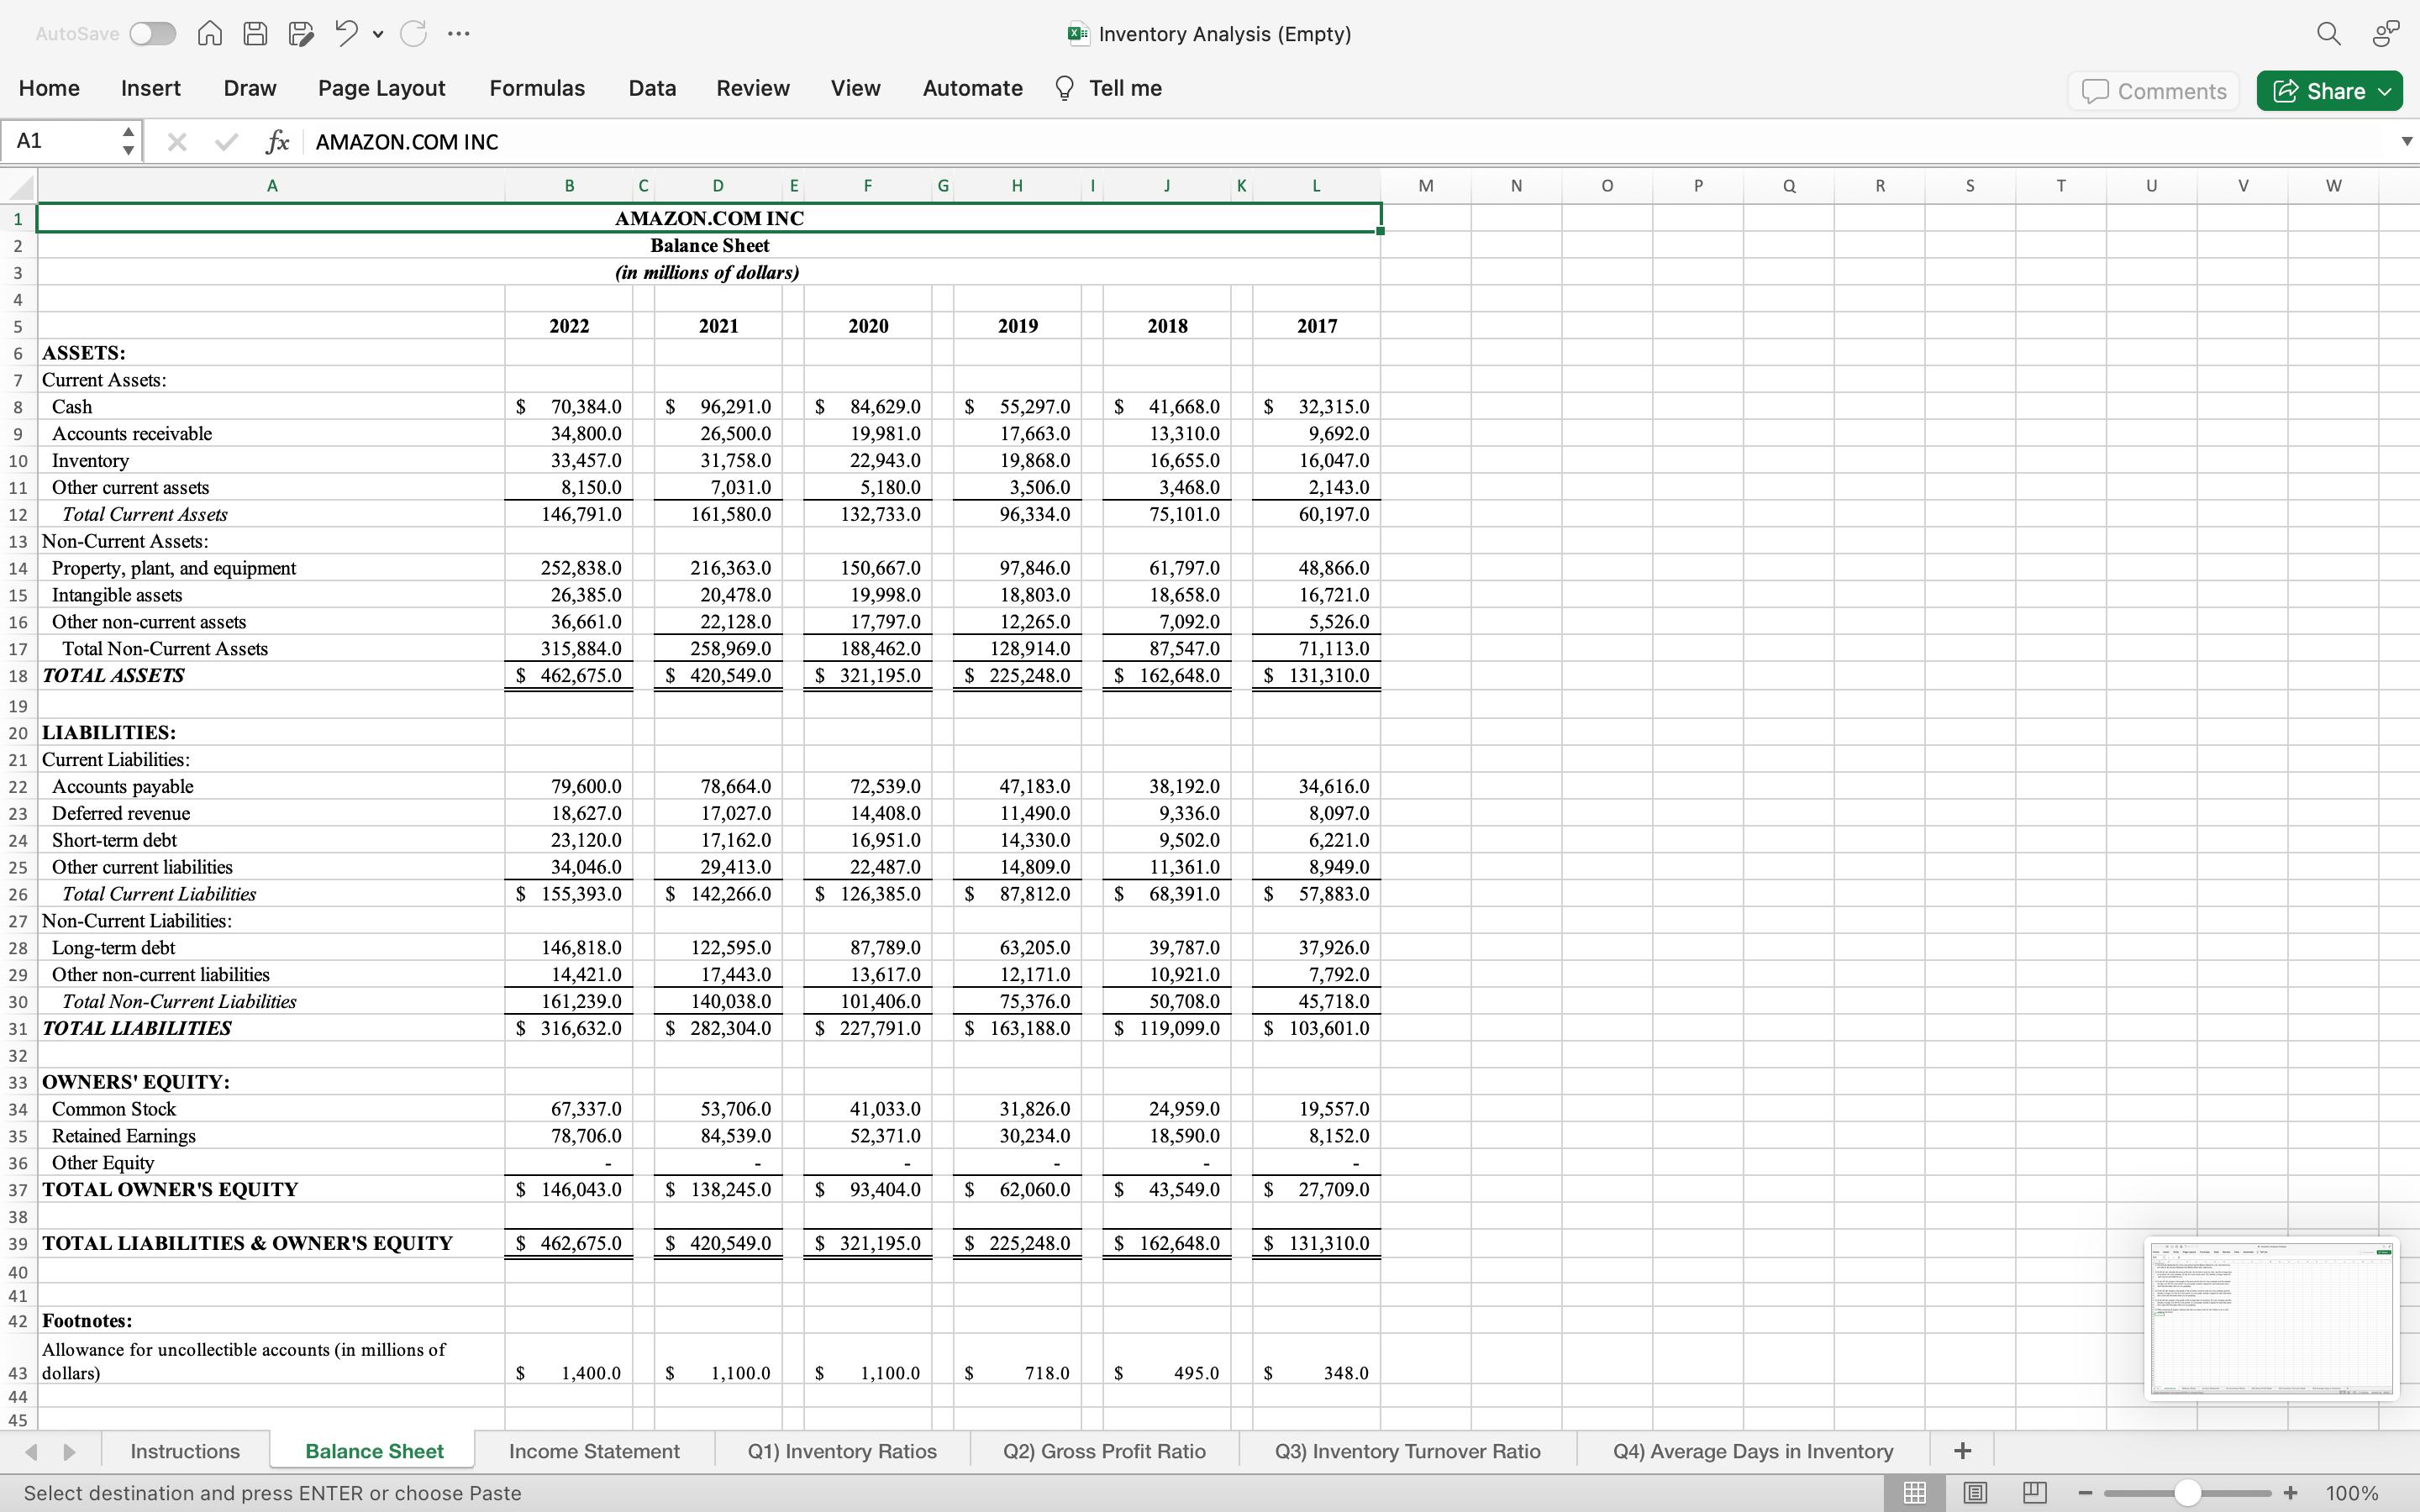
AutoSave Inventory Analysis (Empty) Formulas Data Review View Automate Tell me Home Insert Draw Page Layout A1 fx AMAZON.COM INC A 1 2 3 4 5 6 ASSETS: 7 Current Assets: 8 Cash 9 Accounts receivable 10 Inventory 11 Other current assets 12 Total Current Assets 13 Non-Current Assets: 14 Property, plant, and equipment 15 Intangible assets 16 Other non-current assets 17 Total Non-Current Assets 18 TOTAL ASSETS 19 20 LIABILITIES: 21 Current Liabilities: Accounts payable 22 23 Deferred revenue 24 Short-term debt 25 Other current liabilities B C D E F G H | J K L M N 2022 AMAZON.COM INC Balance Sheet (in millions of dollars) 2021 2020 2019 2018 2017 $ 70,384.0 34,800.0 $ 96,291.0 26,500.0 $ 84,629.0 $ 19,981.0 17,663.0 55,297.0 $ 41,668.0 13,310.0 $ 32,315.0 9,692.0 33,457.0 31,758.0 22,943.0 19,868.0 16,655.0 16,047.0 8,150.0 7,031.0 5,180.0 3,506.0 3,468.0 2,143.0 146,791.0 161,580.0 132,733.0 96,334.0 75,101.0 60,197.0 252,838.0 26,385.0 216,363.0 20,478.0 150,667.0 97,846.0 61,797.0 48,866.0 19,998.0 18,803.0 18,658.0 16,721.0 36,661.0 315,884.0 22,128.0 258,969.0 17,797.0 12,265.0 7,092.0 5,526.0 188,462.0 128,914.0 87,547.0 71,113.0 $ 462,675.0 $ 420,549.0 $ 321,195.0 $ 225,248.0 $ 162,648.0 $ 131,310.0 79,600.0 78,664.0 72,539.0 47,183.0 38,192.0 34,616.0 18,627.0 17,027.0 14,408.0 11,490.0 9,336.0 8,097.0 23,120.0 17,162.0 16,951.0 14,330.0 9,502.0 6,221.0 34,046.0 29,413.0 22,487.0 14,809.0 11,361.0 8,949.0 $ 142,266.0 $ 126,385.0 $ 87,812.0 $ 68,391.0 $ 57,883.0 122,595.0 17,443.0 140,038.0 87,789.0 13,617.0 101,406.0 63,205.0 39,787.0 37,926.0 12,171.0 75,376.0 10,921.0 50,708.0 $ 316,632.0 $ 282,304.0 $ 227,791.0 $ 163,188.0 $ 119,099.0 7,792.0 45,718.0 $ 103,601.0 26 Total Current Liabilities 27 Non-Current Liabilities: Long-term debt 28 29 Other non-current liabilities $ 155,393.0 146,818.0 14,421.0 161,239.0 30 Total Non-Current Liabilities 31 TOTAL LIABILITIES 32 33 OWNERS' EQUITY: 34 Common Stock 35 Retained Earnings 36 Other Equity 37 TOTAL OWNER'S EQUITY 38 39 TOTAL LIABILITIES & OWNER'S EQUITY 40 41 42 Footnotes: 67,337.0 78,706.0 53,706.0 84,539.0 41,033.0 52,371.0 31,826.0 30,234.0 24,959.0 18,590.0 19,557.0 8,152.0 $ 146,043.0 $ 138,245.0 $ 93,404.0 $ 62,060.0 $ 43,549.0 $ 27,709.0 $ 462,675.0 $ 420,549.0 $ 321,195.0 $ 225,248.0 $ 162,648.0 $ 131,310.0 Allowance for uncollectible accounts (in millions of 43 dollars) $ 1,400.0 $ 1,100.0 $ 1,100.0 $ 718.0 $ 495.0 S 348.0 44 45 Instructions Balance Sheet o P Q R S Comments Share T U V W BD Income Statement Q1) Inventory Ratios Q2) Gross Profit Ratio Q3) Inventory Turnover Ratio Q4) Average Days in Inventory + E + 100% Select destination and press ENTER or choose Paste
Step by Step Solution
There are 3 Steps involved in it

Get step-by-step solutions from verified subject matter experts