

Question: Hello! I am specifically looking for help with questions 7 through 10. Thank you! Part 1 Chapters 1-4 Cable Tech Bell Corporation (CTB) operates in

Hello! I am specifically looking for help with questions 7 through 10. Thank you!
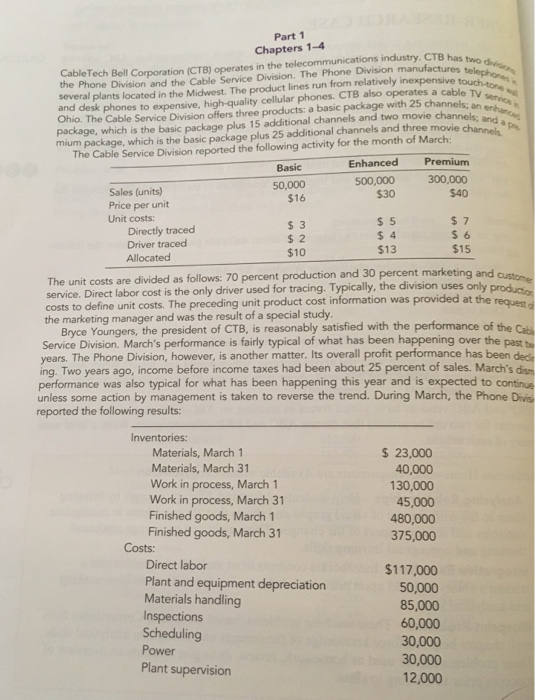
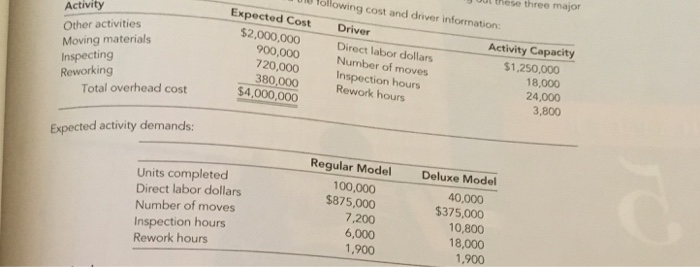
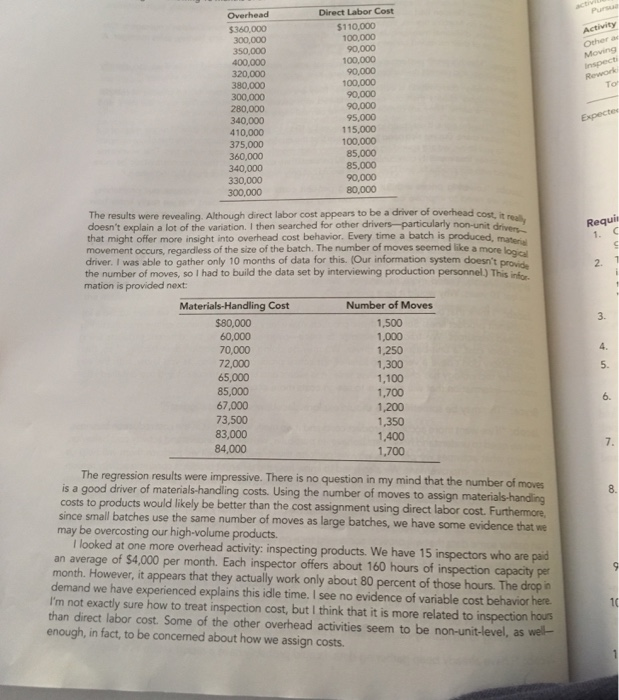
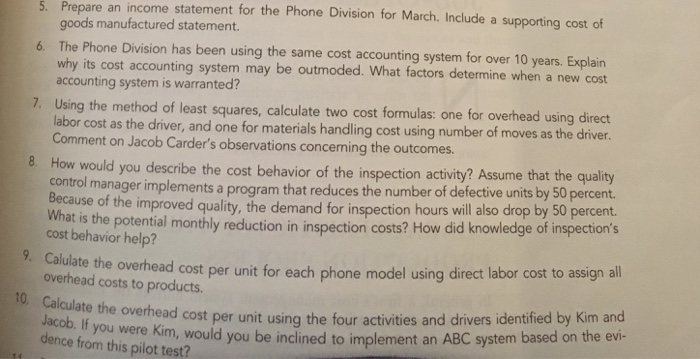
Part 1 Chapters 1-4 Cable Tech Bell Corporation (CTB) operates in the telecommunications industry. CTB has two the Phone Division and the Cable Service Division. The Phone Division manufactures tel several plants located in the Midwest. The product lines run from relatively inexpensive and desk phones to expensive, high-quality cellular phones. CTB also operates a cable TV Ohio. The Cable Service Division offers three products: a basic package with 25 channels; ane package, which is the basic package plus 15 additional channels and two movie channels: and mium package, which is the basic package plus 25 additional channels and three movie chna The Cable Service Division reported the following activity for the month of March: Enhanced Premium 500,000 300,000 $40 Basic 50,000 $16 Sales (units) Price per unit Unit costs: $30 Directly traced Driver traced Allocated $ 3 $ 2 $10 s 5 $ 4 $13 S 6 $15 70 percent production and 30 percent marketing and The unit costs are divided as follows: service. Direct labor cost is the only driver used for tracing. Typically, the division uses to define unit costs. The preceding unit product cost information was provided at the reque the marketing manager and was the result of a special study. Bryce Youngers, the president of CTB, is reasonably satisfied with the performance of the Cab Service Division. March's performance is fairly typical of what has been happening over the pas t years. The Phone Division, however, is another matter. Its overall profit performance has been dedi ing. Two years ago, income before income taxes had been about 25 percent of sales. March's dism performance was also typical for what has been happening this year and is expected to continue unless some action by management is taken to reverse the trend. During March, the Phone Divisi reported the following results: Inventories: Materials, March 1 Materials, March 31 Work in process, March 1 Work in process, March 31 Finished goods, March1 Finished goods, March 31 $ 23,000 40,000 45,000 480,000 375,000 Costs: Direct labor Plant and equipment depreciation Materials handling $117,000 50,000 85,000 60,000 30,000 30,000 12,000 Scheduling Power Plant supervision g out these three major liu following cost and driver inforrmation Expected Cost DriverAeco Activity Other activities Moving materials Inspecting Reworking $2,000,000 Activity Capacity 900,000 720,000 380,000 $4,000,000 Direct labor dollars Number of moves Inspection hours Rework hours $1,250,000 18,000 24,000 3,800 Total overhead cost Expected activity demands: Regular Model Deluxe Model Units completed Direct labor dollars Number of moves Inspection hours Rework hours 100,000 $875,000 7,200 6,000 1,900 40,000 $375,000 10,800 8,000 1,900 Manufacturing engineering Sales commissions Salary, sales supervisor Supplies Warranty work Rework $21,000 120,000 10,000 17,000 40,000 30,000 Direct Labor Cost $110,000 100,000 90,000 100,000 $360,000 300,000 100,000 90,000 To 280,000 340,000 410,000 375,000 360,000 340,000 330,000 300,000 95,000 115,000 100,000 85,000 80,000 The results were revealing. Although direct labor cost appears to be a driver of overhead cost, it doesn't explain a lot of the variation. I then searched for other drivers-particularly non-unit drve that might offer more insight into overhead cost behavior. Every time a batch is produced, ma movement occurs, regardless of the size of the batch. The number of moves seemed like a more driver. I was able to gather only 10 months of data for this. (Our information system doesn't proi the number of moves, so I had to build the data set by interviewing production personnel) This ino Re mation is provided next: Materials-Handling Cost $80,000 60,000 70,000 72,000 65,000 85,000 67,000 73,500 83,000 84,000 Number of Moves 1,500 1,000 1,250 1,300 1,100 1,700 1,200 1,350 1,400 1,700 3. 6. The regression results were impressive. There is no question in my mind that the number of moves is a good driver of materials-handling costs. Using the number of moves to costs to products would likely be better than the cost assignment using direct labor cost. assign since small batches use the same number of moves as large batches, we have some evidence that we may be overcosting our high-volume products I looked at one more overhead activity: inspecting products. We have 15 inspectors who are paid an average of $4,000 per month. Each inspector offers about 160 hours of inspection capacity per month. However, it appears that they actually work only about 80 percent of those hours. The drop in demand we have experienced explains this idle time. I see no evidence of variable cost behavior here I'm not exactly sure how to treat inspection cost, but I think that it is more related to inspection hours than direct labor cost. Some of the other overhead activities seem to be non-unit-level, as well- enough, in fact, to be concemed about how we assign costs 5. Prepare an income statement for the Phone Division for March. Include a supporting cost of goods manufactured statement. The Phone Division has been using the same cost accounting system for over 10 years. Explain why its cost accounting system may be outmoded. What factors determine when a new cost accounting system is warranted? 6. 7. Using the method of least squares, calculate formulas: one for overhead using direct labor cost as the driver, and one for materials handling cost using number of moves as the driver. Comment on Jacob Carder's observations concerning the outcomes. 8. How would you describe the cost behavior of the inspection activity? Assume that the quality control Because of the improved quality, the d What is the potential monthly reduction in inspection costs? How did knowled manager implements a program that reduces the number of defective units by 50 percent. emand for inspection hours will also drop by 50 percent. ge of inspection's cost behavior help? ulate the overhead cost per unit for each phone model using direct labor cost to assign all overhead costs to products. 10 Calculate the overhead If you ead cost per unit using the four activities and drivers identified by Kim and were Kim, would you be inclined to implement an ABC system based on the evi- Jacob. dence from this pilot test? Part 1 Chapters 1-4 Cable Tech Bell Corporation (CTB) operates in the telecommunications industry. CTB has two the Phone Division and the Cable Service Division. The Phone Division manufactures tel several plants located in the Midwest. The product lines run from relatively inexpensive and desk phones to expensive, high-quality cellular phones. CTB also operates a cable TV Ohio. The Cable Service Division offers three products: a basic package with 25 channels; ane package, which is the basic package plus 15 additional channels and two movie channels: and mium package, which is the basic package plus 25 additional channels and three movie chna The Cable Service Division reported the following activity for the month of March: Enhanced Premium 500,000 300,000 $40 Basic 50,000 $16 Sales (units) Price per unit Unit costs: $30 Directly traced Driver traced Allocated $ 3 $ 2 $10 s 5 $ 4 $13 S 6 $15 70 percent production and 30 percent marketing and The unit costs are divided as follows: service. Direct labor cost is the only driver used for tracing. Typically, the division uses to define unit costs. The preceding unit product cost information was provided at the reque the marketing manager and was the result of a special study. Bryce Youngers, the president of CTB, is reasonably satisfied with the performance of the Cab Service Division. March's performance is fairly typical of what has been happening over the pas t years. The Phone Division, however, is another matter. Its overall profit performance has been dedi ing. Two years ago, income before income taxes had been about 25 percent of sales. March's dism performance was also typical for what has been happening this year and is expected to continue unless some action by management is taken to reverse the trend. During March, the Phone Divisi reported the following results: Inventories: Materials, March 1 Materials, March 31 Work in process, March 1 Work in process, March 31 Finished goods, March1 Finished goods, March 31 $ 23,000 40,000 45,000 480,000 375,000 Costs: Direct labor Plant and equipment depreciation Materials handling $117,000 50,000 85,000 60,000 30,000 30,000 12,000 Scheduling Power Plant supervision g out these three major liu following cost and driver inforrmation Expected Cost DriverAeco Activity Other activities Moving materials Inspecting Reworking $2,000,000 Activity Capacity 900,000 720,000 380,000 $4,000,000 Direct labor dollars Number of moves Inspection hours Rework hours $1,250,000 18,000 24,000 3,800 Total overhead cost Expected activity demands: Regular Model Deluxe Model Units completed Direct labor dollars Number of moves Inspection hours Rework hours 100,000 $875,000 7,200 6,000 1,900 40,000 $375,000 10,800 8,000 1,900 Manufacturing engineering Sales commissions Salary, sales supervisor Supplies Warranty work Rework $21,000 120,000 10,000 17,000 40,000 30,000 Direct Labor Cost $110,000 100,000 90,000 100,000 $360,000 300,000 100,000 90,000 To 280,000 340,000 410,000 375,000 360,000 340,000 330,000 300,000 95,000 115,000 100,000 85,000 80,000 The results were revealing. Although direct labor cost appears to be a driver of overhead cost, it doesn't explain a lot of the variation. I then searched for other drivers-particularly non-unit drve that might offer more insight into overhead cost behavior. Every time a batch is produced, ma movement occurs, regardless of the size of the batch. The number of moves seemed like a more driver. I was able to gather only 10 months of data for this. (Our information system doesn't proi the number of moves, so I had to build the data set by interviewing production personnel) This ino Re mation is provided next: Materials-Handling Cost $80,000 60,000 70,000 72,000 65,000 85,000 67,000 73,500 83,000 84,000 Number of Moves 1,500 1,000 1,250 1,300 1,100 1,700 1,200 1,350 1,400 1,700 3. 6. The regression results were impressive. There is no question in my mind that the number of moves is a good driver of materials-handling costs. Using the number of moves to costs to products would likely be better than the cost assignment using direct labor cost. assign since small batches use the same number of moves as large batches, we have some evidence that we may be overcosting our high-volume products I looked at one more overhead activity: inspecting products. We have 15 inspectors who are paid an average of $4,000 per month. Each inspector offers about 160 hours of inspection capacity per month. However, it appears that they actually work only about 80 percent of those hours. The drop in demand we have experienced explains this idle time. I see no evidence of variable cost behavior here I'm not exactly sure how to treat inspection cost, but I think that it is more related to inspection hours than direct labor cost. Some of the other overhead activities seem to be non-unit-level, as well- enough, in fact, to be concemed about how we assign costs 5. Prepare an income statement for the Phone Division for March. Include a supporting cost of goods manufactured statement. The Phone Division has been using the same cost accounting system for over 10 years. Explain why its cost accounting system may be outmoded. What factors determine when a new cost accounting system is warranted? 6. 7. Using the method of least squares, calculate formulas: one for overhead using direct labor cost as the driver, and one for materials handling cost using number of moves as the driver. Comment on Jacob Carder's observations concerning the outcomes. 8. How would you describe the cost behavior of the inspection activity? Assume that the quality control Because of the improved quality, the d What is the potential monthly reduction in inspection costs? How did knowled manager implements a program that reduces the number of defective units by 50 percent. emand for inspection hours will also drop by 50 percent. ge of inspection's cost behavior help? ulate the overhead cost per unit for each phone model using direct labor cost to assign all overhead costs to products. 10 Calculate the overhead If you ead cost per unit using the four activities and drivers identified by Kim and were Kim, would you be inclined to implement an ABC system based on the evi- Jacob. dence from this pilot test
Step by Step Solution
There are 3 Steps involved in it

Get step-by-step solutions from verified subject matter experts