

Question: Hello I am trying to make two data table from the dataset: https://controllerdata.lacity.org/Statistics/Demographic-and-Economic-Statistics/9z75-k9sy uisng R One looking at the medan age from the years 2007-2014
Hello I am trying to make two data table from the dataset: https://controllerdata.lacity.org/Statistics/Demographic-and-Economic-Statistics/9z75-k9sy uisng R
One looking at the medan age from the years 2007-2014
the other one looking at unemployment rate from the years 2007-2014
My output isnt showing my chart and im not sure why
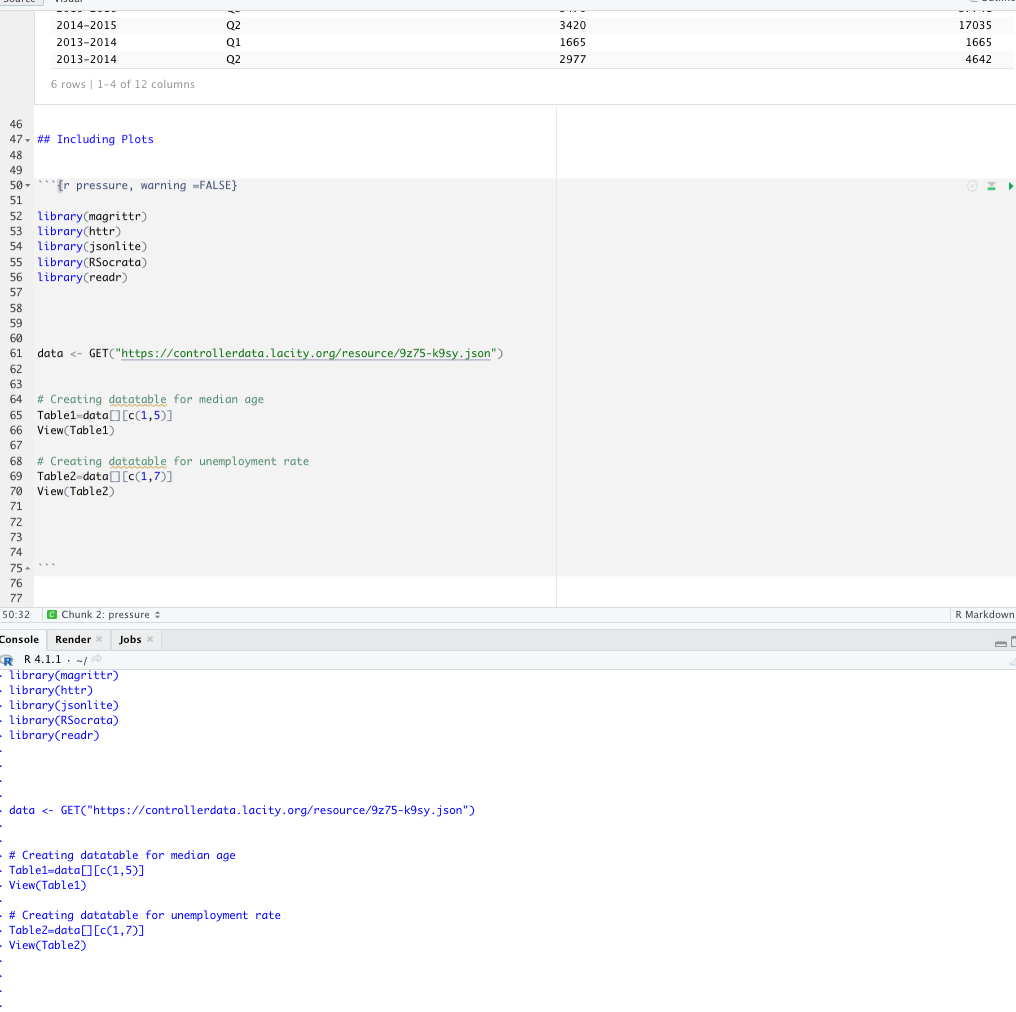
-. ..- 2014-2015 3420 17035 2013-2014 1665 1665 2013-2014 2977 4642 6 rows | 1-4 of 12 columns 46 47 - ## Including Plots 48 49 50- `{r pressure, warning =FALSE} 51 52 library(magrittr) 53 library(http) 54 library(jsonlite) 55 library (RSocrata) 56 library(readr) 57 58 59 60 61 data
Step by Step Solution
There are 3 Steps involved in it
1 Expert Approved Answer
Step: 1 Unlock

Question Has Been Solved by an Expert!
Get step-by-step solutions from verified subject matter experts
Step: 2 Unlock
Step: 3 Unlock