

Question: Hello. I am working on a multi question statistics and describing data work. It also contains standard deviation, histograms and box plots. I am confused
Hello. I am working on a multi question statistics and describing data work. It also contains standard deviation, histograms and box plots. I am confused where to start and how to do it. I need to send photos in order for you to understand the assignment.
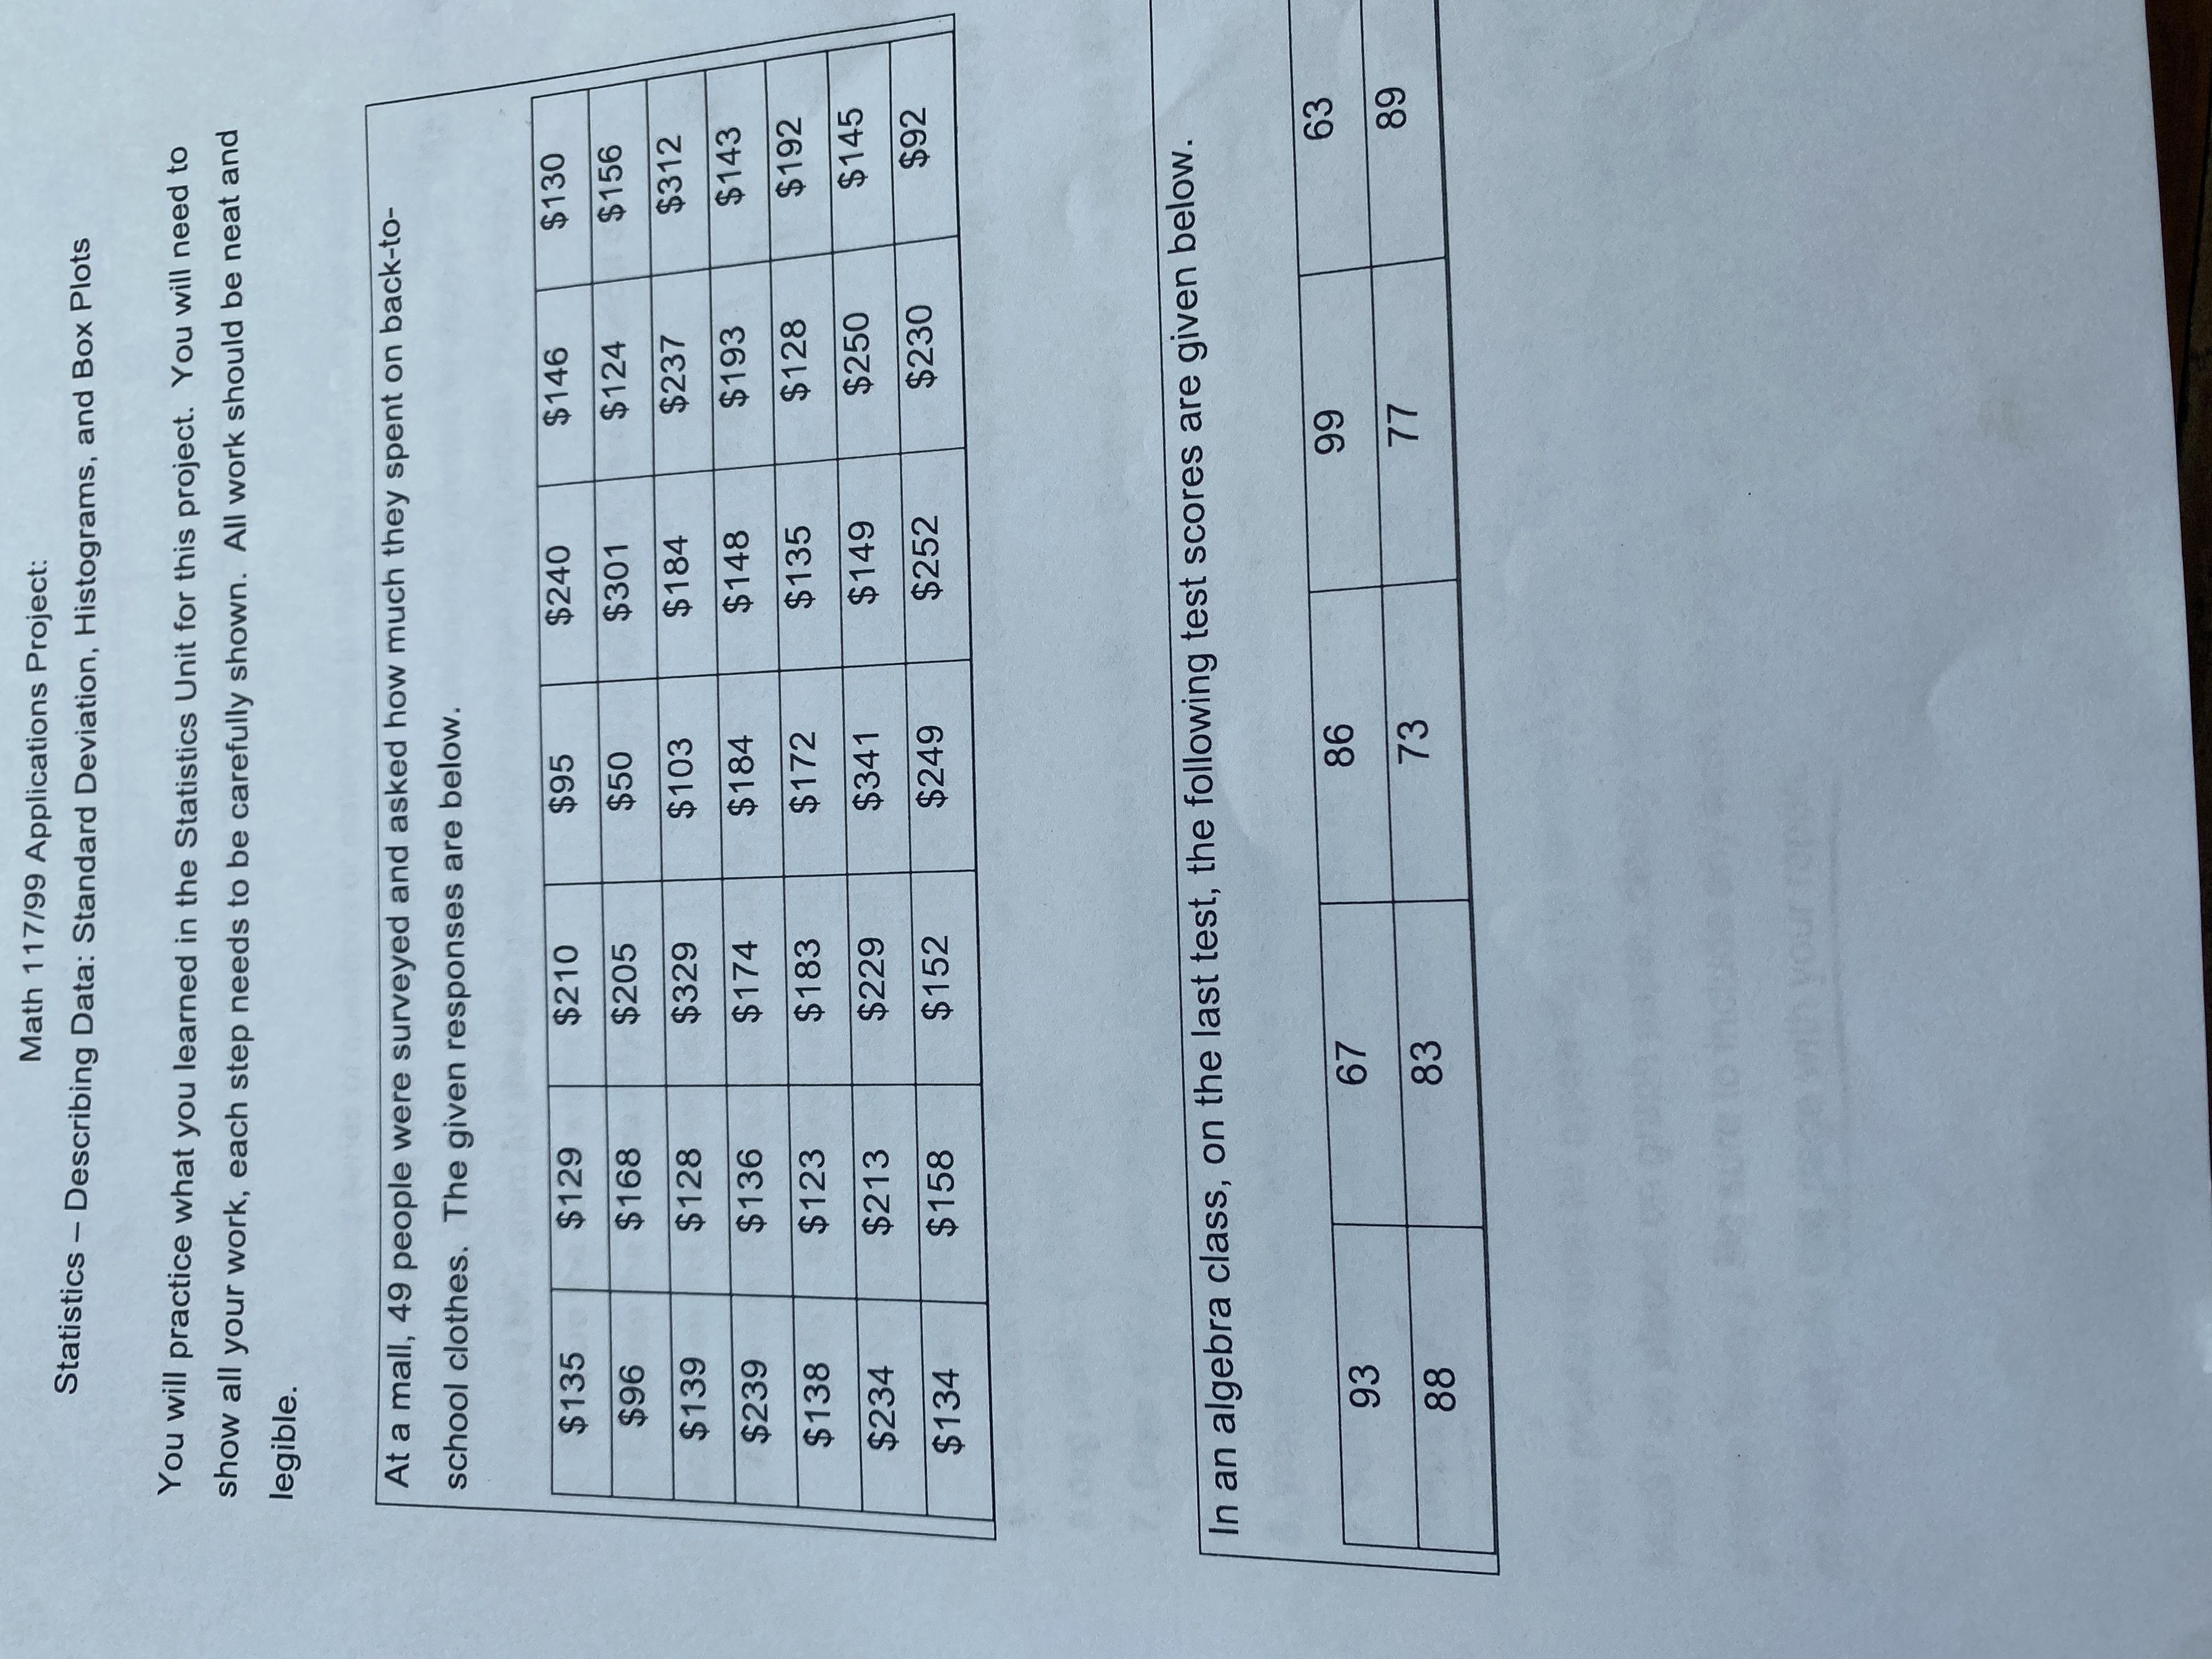
Math 117/99 Applications Project: Statistics - Describing Data: Standard Deviation, Histograms, and Box Plots You will practice what you learned in the Statistics Unit for this project. You will need to show all your work, each step needs to be carefully shown. All work should be neat and legible. At a mall, 49 people were surveyed and asked how much they spent on back-to- school clothes. The given responses are below. $135 $129 $210 $95 $240 $146 $130 $96 $168 $205 $50 $301 $124 $156 $139 $128 $329 $ 103 $ 184 $237 $312 $239 $136 $ 174 $184 $148 $193 $143 $138 $123 $183 $172 $135 $128 $192 $234 $213 $229 $341 $149 $250 $145 $134 $158 $152 $249 $252 $230 $92 In an algebra class, on the last test, the following test scores are given below. 93 67 86 99 63 89 88 83 73 77 with your one
Step by Step Solution
There are 3 Steps involved in it

Get step-by-step solutions from verified subject matter experts