

Question: Hello, I cannot find the solutions for the yellow area in the black-outlined cells. I would greatly appreciate the formulas being shown that gave the
Hello, I cannot find the solutions for the yellow area in the black-outlined cells. I would greatly appreciate the formulas being shown that gave the right solution and a description of why. Thank you!
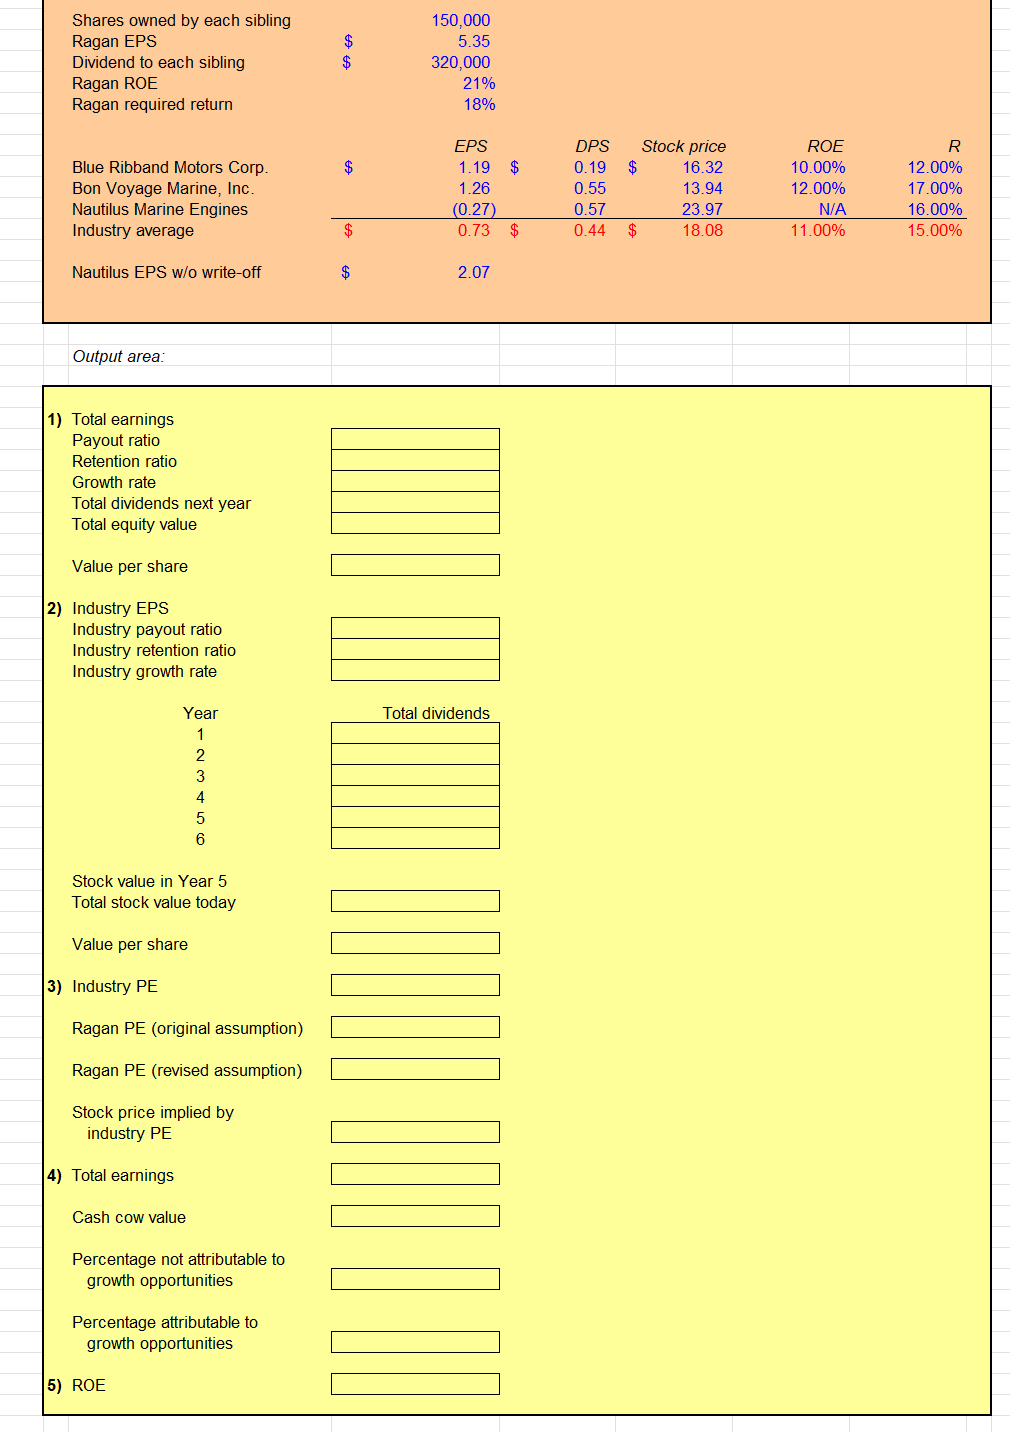
Shares owned by each sibling Ragan EPS Dividend to each sibling Ragan ROE Ragan required return Blue Ribband Motors Corp. Bon Voyage Marine, Inc. Nautilus Marine Engines Industry average Nautilus EPS w/o write-off \begin{tabular}{rr} & 150,000 \\ $ & 5.35 \\ $ & 320,000 \\ & 21% \\ & 18% \end{tabular} \begin{tabular}{|c|c|c|c|c|c|c|} \hline \multirow{3}{*}{$} & EPS & \multirow[b]{2}{*}{$} & DPS & Stock price & \multirow{2}{*}{\begin{tabular}{r} ROE \\ 10.00% \end{tabular}} & R \\ \hline & 1.19 & & 0.19 & 16.32 & & 12.00% \\ \hline & 1.26 & & 0.55 & 13.94 & 12.00% & 17.00% \\ \hline & (0.27) & & 0.57 & 23.97 & N/A & 16.00% \\ \hline & 0.73 & $ & 0.44 & 18.08 & 11.00% & 15.00% \\ \hline \end{tabular} $ 2.07 Output area: 1) Total earnings Payout ratio Retention ratio Growth rate Total dividends next year Total equity value Value per share 2) Industry EPS Industry payout ratio Industry retention ratio Industry growth rate Year 1 2 3 4 5 6 Stock value in Year 5 Total stock value today Value per share 3) Industry PE Ragan PE (original assumption) Ragan PE (revised assumption) Stock price implied by industry PE 4) Total earnings Cash cow value Percentage not attributable to growth opportunities Percentage attributable to growth opportunities \begin{tabular}{|l|} \hline \\ \hline \\ \hline \\ \hline \\ \hline \end{tabular} \begin{tabular}{|l|} \hline \\ \hline \\ \hline \end{tabular} Total dividends \begin{tabular}{|l|} \hline \\ \hline \\ \hline \\ \hline \\ \hline \\ \hline \end{tabular} 5) ROE
Step by Step Solution
There are 3 Steps involved in it

Get step-by-step solutions from verified subject matter experts