

Question: Hello, I have a CVP graph that I need to 1) Identify the Loss Area and 2) Profit Area and 3) Identify the Break Even
Hello, I have a CVP graph that I need to 1) Identify the Loss Area and 2) Profit Area and 3) Identify the Break Even Point. Can you input those items into my existing chart or show me how to do that?
| Cost & Profit Scenarios | |||
| (N) Number of Units Sold | (S) Sales Revenue | (TC) Total Costs | (P) Profit |
| 0 | $0 | $4,065,000 | $ (4,065,000) |
| 10,000 | $2,400,000 | $4,935,000 | $ (2,535,000) |
| 20,000 | $4,800,000 | $5,805,000 | $ (1,005,000) |
| 30,000 | $7,200,000 | $6,675,000 | $ 525,000 |
| 40,000 | $9,600,000 | $7,545,000 | $ 2,055,000 |
| 50,000 | $12,000,000 | $8,415,000 | $ 3,585,000 |
| 60,000 | $14,400,000 | $9,285,000 | $ 5,115,000 |
| 70,000 | $16,800,000 | $10,155,000 | $ 6,645,000 |
| 80,000 | $19,200,000 | $11,025,000 | $ 8,175,000 |
| 90,000 | $21,600,000 | $11,895,000 | $ 9,705,000 |
| 100,000 | $24,000,000 | $12,765,000 | $ 11,235,000 |
| 110,000 | $26,400,000 | $13,635,000 | $ 12,765,000 |
| 120,000 | $28,800,000 | $14,505,000 | $ 14,295,000 |
| 130,000 | $31,200,000 | $15,375,000 | $ 15,825,000 |
| 140,000 | $33,600,000 | $16,245,000 | $ 17,355,000 |
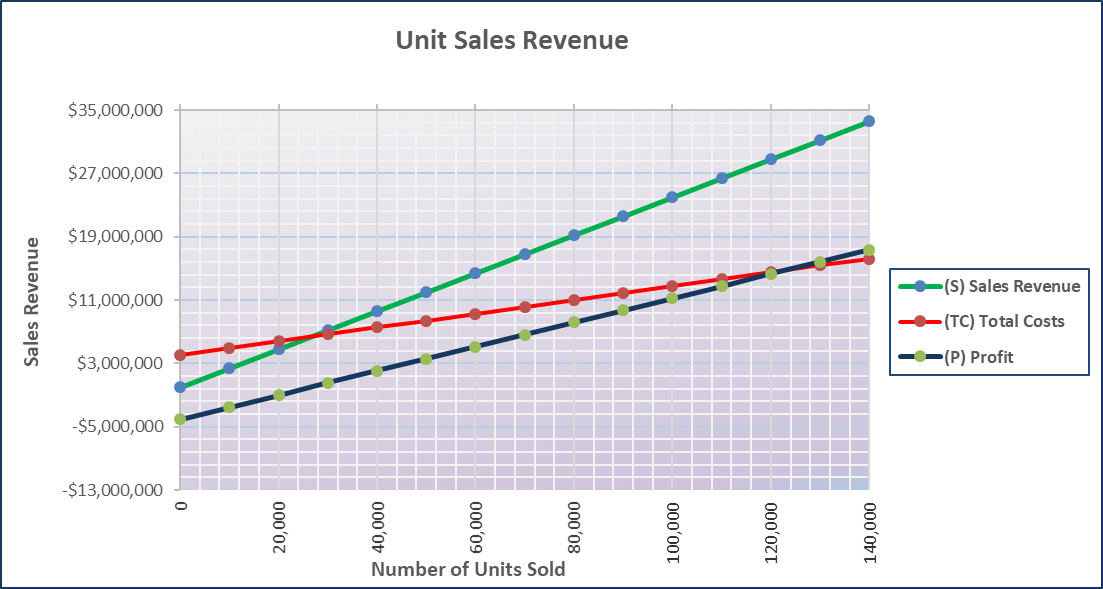
Unit Sales Revenue $35,000,000 $27,000,000 $19,000,000 Sales Revenue $11,000,000 () Sales Revenue ---(TC) Total Costs (P) Profit $3,000,000 -$5,000,000 -$13,000,000 20,000 40,000 60,000 80,000 100,000 120,000 140,000 Number of Units Sold
Step by Step Solution
There are 3 Steps involved in it
1 Expert Approved Answer
Step: 1 Unlock

Question Has Been Solved by an Expert!
Get step-by-step solutions from verified subject matter experts
Step: 2 Unlock
Step: 3 Unlock