

Question: Hello, I have an excel file with 650 data points of xyz coordinates. I would like to know how i can easily plot these points
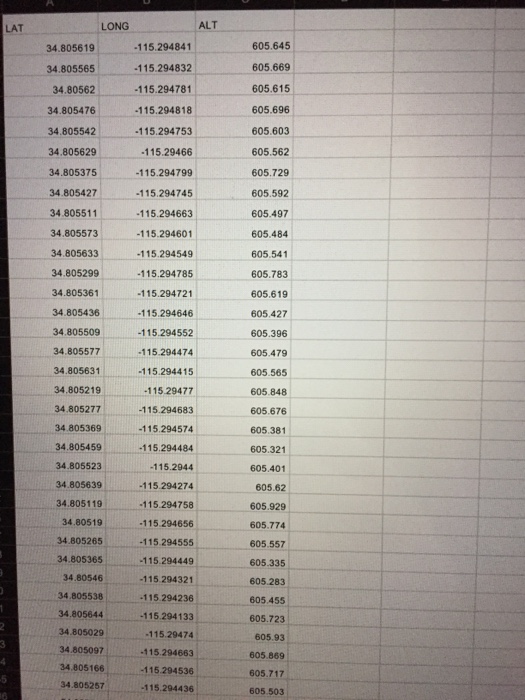
LAT LONG ALT 115.294841 -115.294832 -115.294781 -115.294818 115.294753 115.29466 115.294799 115.294745 115.294663 -115.294601 115.294549 -115.294785 -115.294721 -115.294646 -115.294552 115.294474 -115.294415 -115.29477 115.294683 -115.294574 115.294484 115.2944 -115.294274 -115.294758 -115.294656 115.294555 -115.294449 -115 294321 115.294236 115.294133 115.29474 115.294663 -115.294536 115.294436 605.645 34.805619 34.805565 34.80562 605.669 605.615 605.696 34.805476 605.603 605.562 605.729 605.592 605.497 605.484 605.541 605.783 605.619 605.427 605.396 605.479 605.565 605.848 605.676 605.381 605.321 605.401 605.62 605.929 605.774 605.557 605.335 605.283 605.455 605.723 605.93 605.869 605.717 605.503 34.805542 34.805629 34.805375 34.805427 34.805511 34.805573 34.805633 34.805299 34.805361 34.805436 34.805509 34.805577 34.805631 34,805219 34.805277 34.805369 34.805459 34.805523 34.805639 34.805119 34.80519 34.805265 34.805365 34.80546 34.805538 34.805644 34.805029 34.805097 34.805166 34.805257
Step by Step Solution
There are 3 Steps involved in it

Get step-by-step solutions from verified subject matter experts