

Question: Hello! I have the following question based off of Python. Assume you have the following portfolio of stocks including the number of shares (the quantity)
Hello! I have the following question based off of Python.
Assume you have the following portfolio of stocks including the number of shares (the quantity) of each stock. You will write a program that will determine the best day in the month of May 2021 to buy or sell the portfolio based on the closing price of the day.
| Currency | Symbol | Quantity |
|---|---|---|
| Apple | AAPL | 20 |
| Beyond Meat | BYND | 30 |
| Chevron | CVX | 40 |
| GameStop | GME | 50 |
| Moderna | MRNA | 60 |
The best day to buy the stocks is when the total closing prices for the portfolio is at the lowest. The best day to sell the stocks is when the toal closing prices for the portfolio is at the highest. Also, assume that you have to buy all or sell all on the same day. You will use the Yahoo Finance module to assist you in the project.
About Yahoo Finance Module
The Yahoo Finance Module (yfinance) gives you access to real-time and historical stock data. To use the Yahoo finance module, you first need to install it. To install the Yahoo Finance Module, run the following command:
pip install yfinance
After you have installed the module, you will need to import it into the program.
import yfinance as yf
Access the functions through yf. You will only be using the download() function to get the prices for a given stock during a given time span. Remember that The first line is done for you below.
Tasks
You will do the following
- The starter code has been created for you. Specifically, there is an example of how you will access historical stock data from Yahoo Finance module. Adapt and use this sample code to get the required data for the stocks above. The stock symbols are provided above, which is needed for the tickers parameter.
- Create a 2D NumPy array which represent the number of shares per stock. Then use the dot product, to find the value of the entire portfolio for each day in May. Create a data frame with the dates and the portfolio values.
- Create a lineplot using seaborn that plots the prices for each stock. The x axis are the days (they can just be days numbered 0 through 20). The y axis is the price of the stocks. HINT: use the pd.melt() function to reconfigure the DataFrame so you can plot multiple lines using the hue parameter in the lineplot() function. After calling pd.melt(), name the value column 'Price' and the variable (column) name 'Stock'.
Answer the questions below.
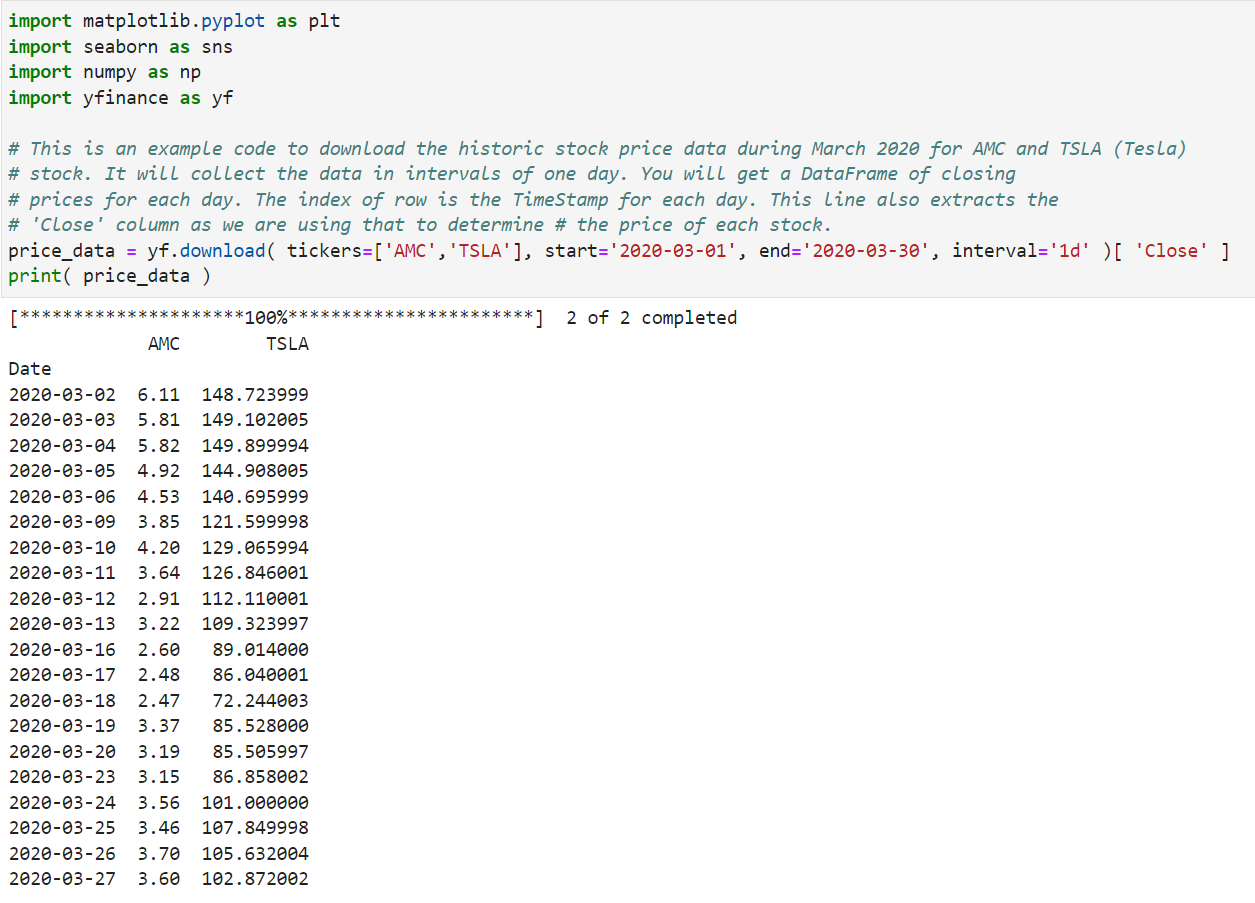
import matplotlib.pyplot as plt import seaborn as sns import numpy as np import yfinance as yf \# This is an example code to download the historic stock price data during March 2020 for AMC and TSLA (Tesla) \# prices. It will collect the data in intervals of one day. You will get a DataFrame of closing \# 'Close' column as we are using that to determine \# the price of each stock. price_data = yf.download( tickers=['AMC', 'TSLA'], start='2020-03-01', end='2020-03-30', interval='1d' )[ 'Close' ] print( price_data) H Starter code for your figure fig = plt. figure ( figsize= (11,8)) * Your code goes here plt. show()
Step by Step Solution
There are 3 Steps involved in it

Get step-by-step solutions from verified subject matter experts