

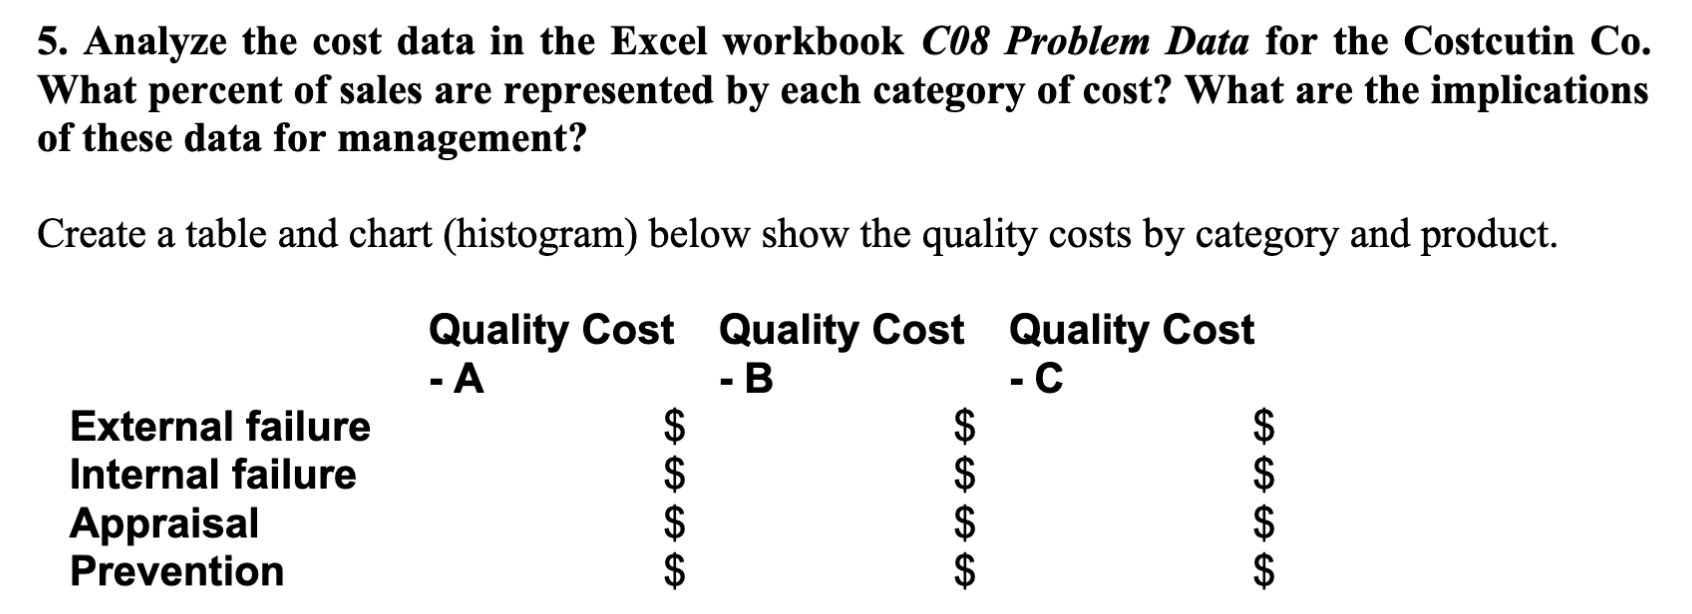
Question: Hello, I have this problem and I would like to see the excel formulas and fonal answer pls 5. Analyze the cost data in the
Hello, I have this problem and I would like to see the excel formulas and fonal answer pls
Step by Step Solution
There are 3 Steps involved in it
1 Expert Approved Answer
Step: 1 Unlock

Question Has Been Solved by an Expert!
Get step-by-step solutions from verified subject matter experts
Step: 2 Unlock
Step: 3 Unlock