

Question: Hello, I have to create a Null Hypothesis but I am not very good. Q13: Employment Status Total Employed Retired Total Count (All) 50.0 22.0
Hello, I have to create a Null Hypothesis but I am not very good.
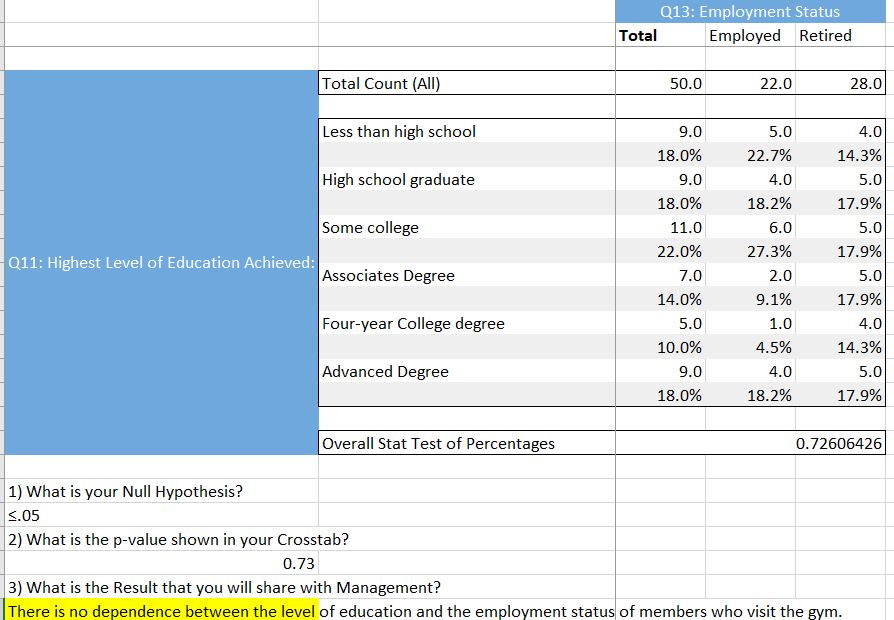
Q13: Employment Status Total Employed Retired Total Count (All) 50.0 22.0 28.0 Less than high school 9.0 5.0 4.0 18.0% 22.7% 14.3% High school graduate 9.0 4.0 5.0 18.0% 18.2% 17.9% Some college 11.0 6.0 5.0 Q11: Highest Level of Education Achieved: 22.0% 27.3% 17.9% Associates Degree 7.0 2.0 5.0 14.0% 9.1% 17.9% Four-year College degree 5.0 1.0 4.0 10.0% 4.5% 14.3% Advanced Degree 9.0 4.0 5.0 18.0% 18.2% 17.9% Overall Stat Test of Percentages 0.72606426 1) What is your Null Hypothesis? 5.05 2) What is the p-value shown in your Crosstab? 0.73 3) What is the Result that you will share with Management? There is no dependence between the level of education and the employment status of members who visit the gym
Step by Step Solution
There are 3 Steps involved in it

Get step-by-step solutions from verified subject matter experts